The train ride from Narita Airport to Tokyo offers occasional glimpses of the tall, multi-circuit and multi-voltage transmission lines common throughout Japan. Starting about 2000, local researchers began observing direct lightning flashes on prototype double circuit lines, constructed to ultra-high voltage dimensions, but operating at 500 kV. These lines are easy to distinguish when ‘flying’ along rights-of-way with Google Earth, since they have phase-to-phase spacing of about 33 m compared to 17 m for normal 500 kV lines.
High-resolution satellite images also clearly resolve the 38 m separation of ground wires on UHV lines and it’s amazing that an optical fiber groundwire (OPGW) with 25 mm diameter can be seen by satellite. Switching to ‘street view’ mode confirms that the UHV lines have 8 bundle conductors versus the four conductor bundles of 500 kV circuits. The 23 m OPGW horizontal separation on 500 kV lines provides a negative shielding angle of about -6.7 at midspan to the phase located 28 m below. This shielding angle is similar to the -6.2 shielding angle for the UHV design, with vertical separation of 32 m. There are also larger differences in vertical separation among phases, i.e. 11 m on 500 kV lines and 19 m on UHV lines.
This past contribution to INMR by Dr. William Chisholm discussed experience with and knowedge from impact of lightning on particularly tall transmission towers.
The 500 kV transmission line connecting the Kashiwazaki Kariwa Nuclear Power Plant to the Nishi-Gunma Switching Station in Japan has many towers with spans exceeding 600 m. These are typically built from hilltop to hilltop, which explains why the average bottom-phase clearance is 70 m. The typical sag of a 600 m span of ACSR conductor, strung to a tension of about 20% rated tensile strength, is estimated from the expression 0.0014 (Span)2/(%RTS) at about 25 m, compared to a sag of 0.0009 (Span)2/(%RTS) or 16 m for the OPGW. This reduces vertical separation between OPGW and top phase from 32 m at midspan to about 23 m at the tower.
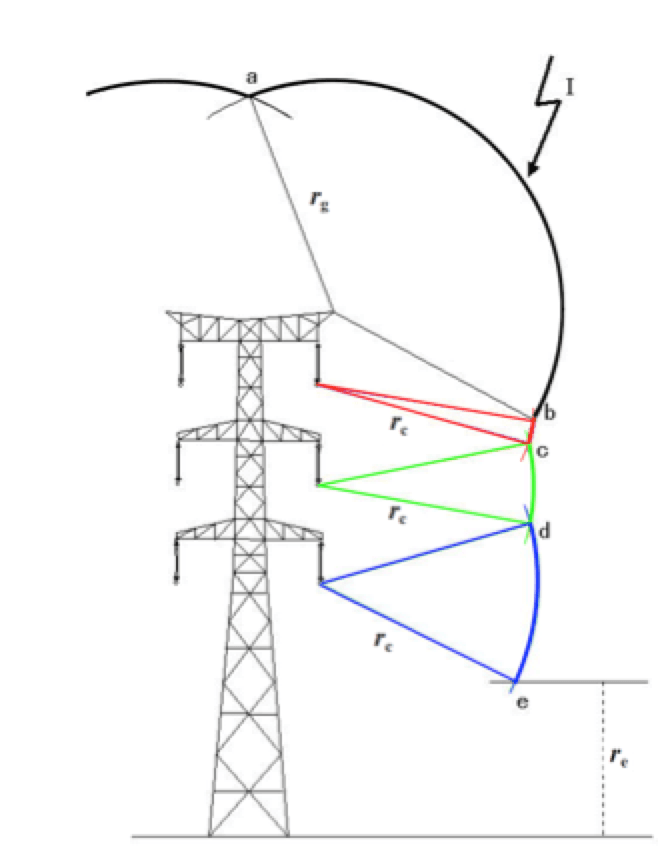
Lightning experts familiar with standard electrogeometric modeling (EGM), e.g. as set out in IEC 62305 with its four levels of ‘rolling sphere radius’ – 20, 30, 45 and 60 m – should become uncomfortable when the phase-to-ground or phase-to-OHGW clearances reach such dimensions. This uncertainty is thought to make the bottom phases vulnerable to side flashes (i.e. in zone d-e of the diagram). However, the diagram also suggests that the upper phases should be well protected compared to bottom phases because they have a small exposure arc (zone b-c).
Findings from research by the Tokyo Electric Power Company appeared in IEEE Transactions on Dielectrics and Electrical Insulation but have not been easily accessible to transmission line lightning specialists in their Power and Energy Society. CIGRE TB 633 (Lightning Striking Characteristics to Very High Structures) was prepared in October 2015 to raise the profile of TEPCO’s research program as a keynote contribution. The 32 pages in Chapter 2 may be of greatest interest to readers since they deal with insulator stress on tall transmission lines. The rest of the document focuses on lightning to freestanding structures, which are mainly sequences of subsequent strokes rather than first strokes. The full description of TEPCO’s test program in TB 633 reports the current splits among overhead groundwires when lightning was observed to terminate at tower top or at midspan. With long span lengths, the current splits at wave peak closely followed the surge impedance models, with about 9% of the current in each OHGW and the remaining 82% flowing down the stricken tower. This is reassuring since proper surge-impedance behavior and high capture efficiency of overhead groundwires (OHGW) is relied on to limit the energy duty on transmission line arresters at lower voltages.
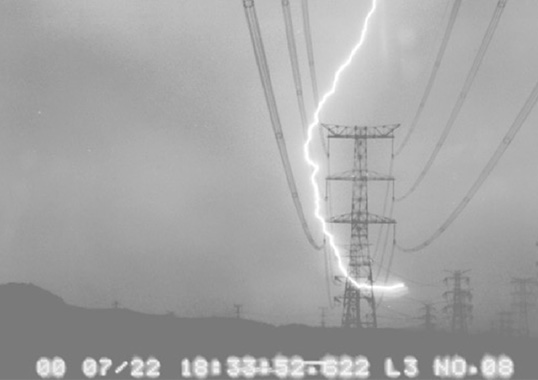
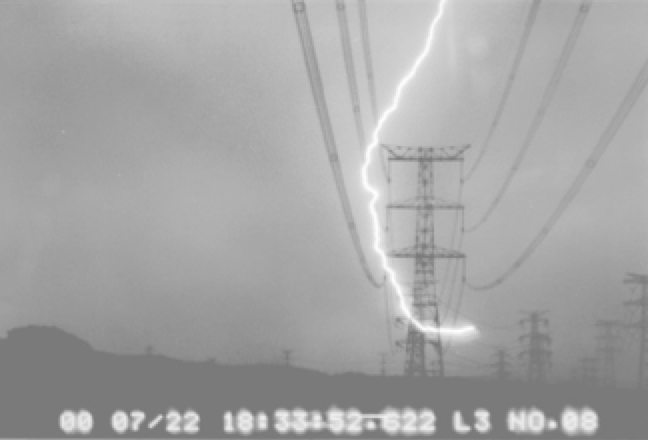
There are intriguing findings (summarized in TB 633) that challenge use of the EGM for tall towers. Over 98% of the flashes terminated normally, as in the first video frame, but about 2% came in from the side to terminate on a phase conductor, as in the second frame. Most important is that shielding failures for the UHV line were equally distributed among all three phases, rather than terminating mainly on the bottom phases.

Once shielding failure occurs, wisdom in IEEE Standard 1243 is that a flashover will occur. The product of the stroke current and the surge impedance of a phase conductor, divided by two (as the current splits equally), generally exceeds the lightning impulse critical flashover level (CFO) of insulation on nearby towers. Even if the first stroke has low amplitude, e.g. 5 kA (associated with 30 m rolling sphere radius), there is high probability that at least one of the subsequent strokes will have a peak current exceeding the median 12 kA. Most tall structure observations worldwide (in TB 633) support this high multiplicity as well as the median value. This calculation, of course, is only valid for long transmission line phases, not for short lengths of substation bus that act mainly as capacitance (if terminated into unprotected equipment) or as a series inductive path to nearby surge arresters.
Moving from HV through EHV and UHV tower dimensions, some of the reasoning in IEEE Standard 1243 also needed adjustment. UHV lines have bundle conductors with lower surge impedance and higher insulation strength. Both these factors increase the ‘critical current’ that causes flashover for a direct first or subsequent stroke. Also, given the difference in waveshape and short time to half-value for subsequent strokes, it makes sense using the 750 kV/m strength of the 1/5 wave rather than the 600 kV/m strength for 1.2/50 wave in the dry arc distance range from 1 to 11 m when calculating critical current for subsequent strokes.
CIGRE TB 633 summarized important lightning experience from 12 countries and the work of CIGRE WG C4.410 served as an important reference as utilities make increasing use of tall towers across new regions.

