Failures of insulators due to pollution flashover can cause potentially long outages and require expensive, time-consuming maintenance. Experience has demonstrated that one of the leading causes of such failures is improper specification of insulators in the first place, meaning that the designs selected prove unable to cope with actual service stresses due to environmental pollution. It is therefore vital for engineers at power supply companies to determine the real pollution characteristics of the environment into which insulators will be put into service.
This edited past contribution to INMR by Igor Gutman of the Independent Insulation Group in Sweden and Wallace Vosloo, retired from of Eskom in South Africa, reviewed practical experience with pollution monitoring techniques and presented principles to convert from one parameter to another. It also discussed how to use these parameters for insulator dimensioning according to the requirements of the IEC 60815.

Leakage Current Measurement
Leakage current flowing on an insulator depends mainly on the characteristics of the pollution on its surface as well as on its geometry and material. Measuring and analyzing leakage current can therefore be useful to estimate pollution severity and risk of flashover.
Leakage current is usually measured by collecting the current at the ground end of energized insulators. The three most common methods for this purpose are:
1. Surge Counting
Number of leakage current pulses (or surges) exceeding some threshold level can be recorded during a period of time. This is important since number of pulses as well as their amplitudes increase when approaching the final stage of the pollution flashover process.
2. Measuring Peak Current
Information about pollution severity on an insulator can be obtained by recording the highest peak current over a given time interval. This parameter can then be related to risk of pollution flashover.

3. Measuring Accumulated Charge
Accumulated charge measurement is performed in the same way as leakage current measurement. However, instead of focusing on the values of the highest peaks, the signal is integrated to represent accumulated charge – a parameter more related to the ageing process on the insulator surface. Over the years, a number of pollution monitors that measure leakage current have been developed, ranging from simple surge counters to advanced multi-channel devices that incorporate integrated meteorological stations.
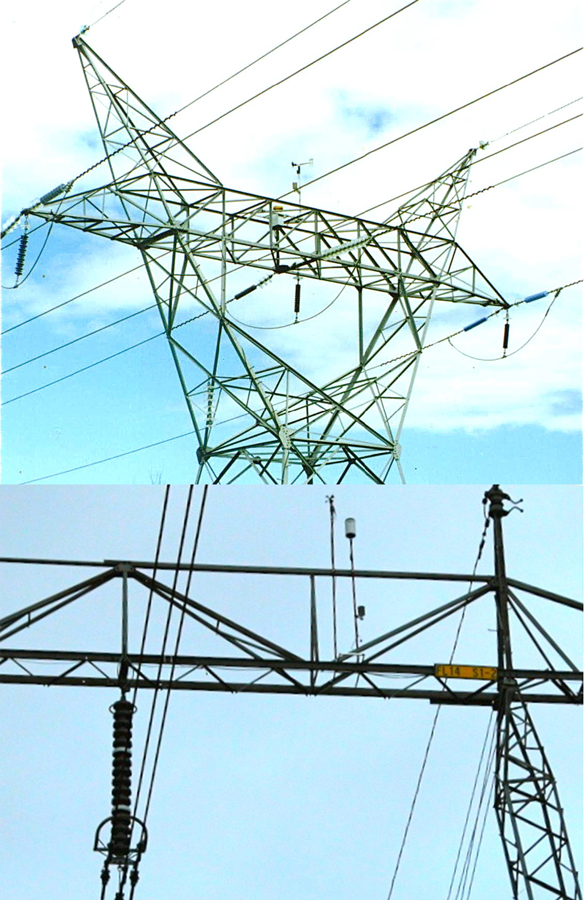
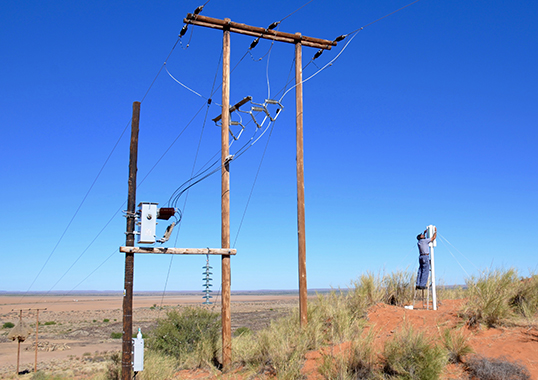
A standard such system now typically includes an integrated weather station to record wind speed and direction, humidity, rainfall, temperature and UV-B radiation. All sampled values are then saved at some user-defined interval, typically every 30 minutes. Recorded data is retrieved using a serial port, which also serves to configure the instrument.
Using such advanced devices, researchers have been able to obtain volumes of leakage current and corresponding weather data that have helped them better understand the physics of pollution flashover on different types of insulators. Sophisticated mathematical approaches have also sometimes been necessary. For example, multivariate analysis (MVA) methods has been used since these are appropriate to study and analyze data structured on many interrelated variables. MVA software has successfully been tested in an ageing and pollution performance study performed on insulators exposed to pollution at the Kelso Test Station on the Indian Ocean coast of South Africa and also at the former Dungeness Test Station on the south coast of the U.K.. Fig. 1 shows an example of applying MVA.
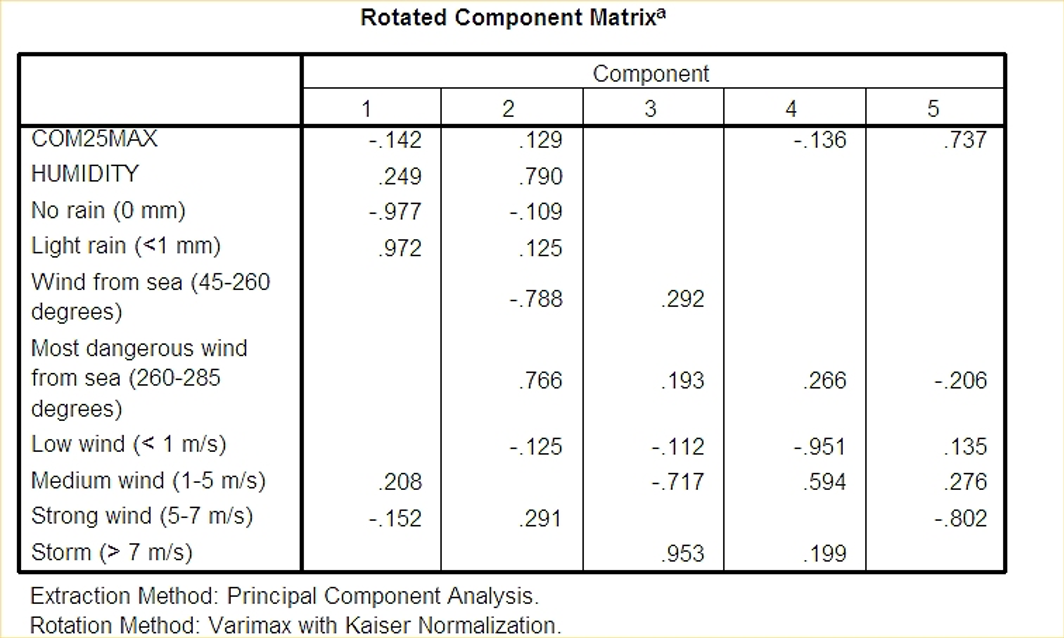
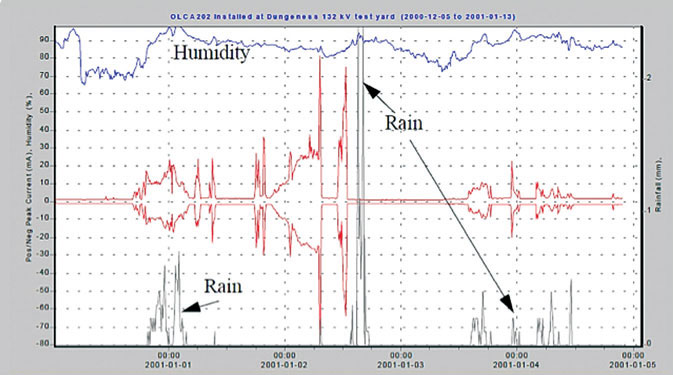
A classical coastal pollution event is characterized by strong wind from the sea followed by some kind of wetting. However, in the case of a silicone rubber insulator, high humidity alone is generally not sufficient to lead to high current. Additional wetting in the form of light rain is needed.
This conclusion is supported by recording a typical pollution event on a silicone rubber insulator. Sensitivity of MVA can be high. For example, during the pre-pollution phase of a past pollution event at the former Dungeness Test Station, salt was transported inland by strong winds. The most dangerous wind direction (associated with the four most severe pollution events and leading to the highest currents) had an angle of between 0 and 20° to the shoreline, due to a wall of sand that protected the site from the perpendicular (90°) direction. Description of the pollution event at the Kelso Test Station on South Africa’s Indian Ocean coast was slightly different. During a pre-pollution phase at Kelso, salt comes in not only from the sea but also from land since wind direction is almost parallel to the coast.
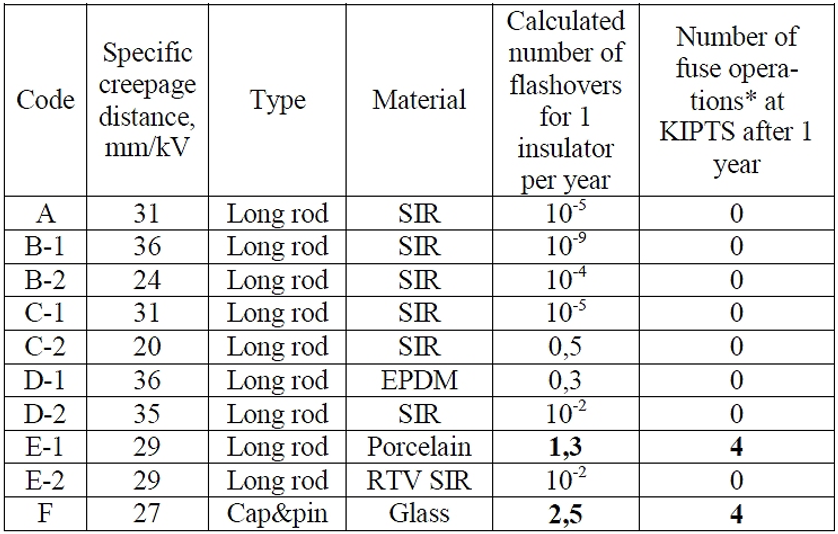
Another practical application of leakage current data would be to convert this into pollution flashover performance curves. This approach was tested by applying the IST program to 10 uniquely different insulators at Eskom’s Koeberg Insulator Pollution Test Station (KIPTS) on the Atlantic coast near Cape Town. Results proved reasonable in predicting outage rate compared to actual experience, i.e. number of blown fuses, (see Fig 2). Results of such field station testing can be used beyond simply assigning a ‘pass/fail’ grade to each insulator tested. For example, they can help estimate the pollution flashover performance of a complete overhead line located in the same area and equipped with these same insulators (geometry and material).
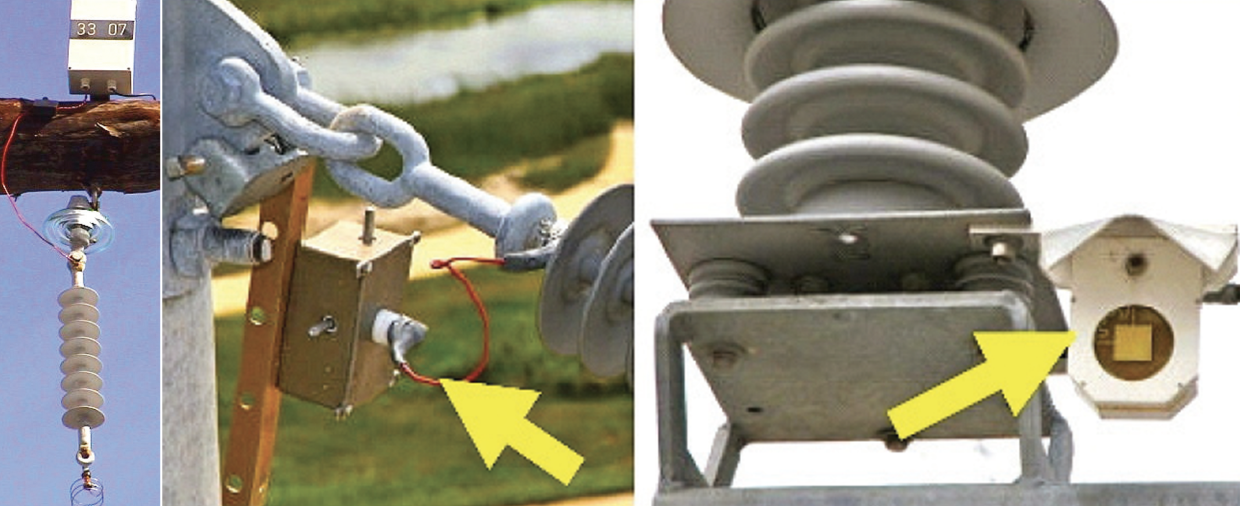
These days, power supply companies are looking for simple and robust systems for pollution monitoring and warning in place of complex ‘research-type’ systems that measure leakage current. This is because uprating/upgrading existing overhead lines requires accurate evaluation of pollution levels. Indeed, attempts to use the systems described above for this purpose have not always been successful because they are expensive and need maintenance at least once a year. Moreover, there were communication problems in many applications. Therefore, single-channel systems (for peak current only) applicable to both overhead lines and substations are now most in demand and under active development. The goal is to have relatively inexpensive and reliable devices cover large areas and allow data collection and transfer via the Internet.
Specific Techniques Applying to Composite Insulators
Specific diagnostic techniques for composite insulators (along with practical examples from field and laboratory investigation) include:
• Hydrophobicity measurement;
• Hydrophobicity transfer (localized ESDD);
• Rapid flashover procedure to obtain dielectric strength of naturally polluted insulators.
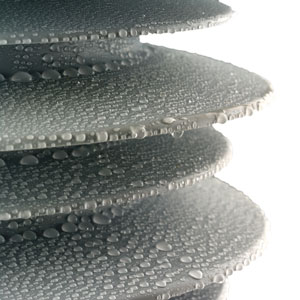
1. Hydrophobicity
Hydrophobicity measurements are performed according to IEC TS 62073 and comparatively simple.

2. Hydrophobicity Transfer (localized ESDD)
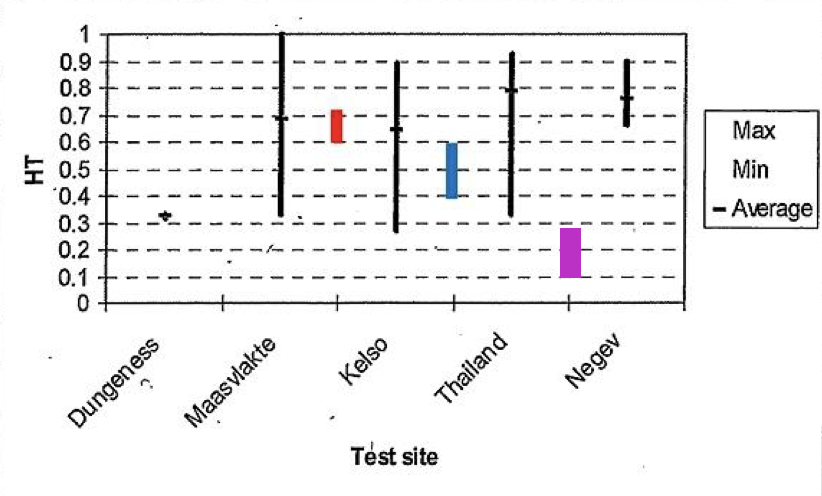
Hydrophobicity transfer (HT) is a measure of a material’s ability to recover hydrophobicity. This process is due to diffusion of low molecular weight species (LMW) in the silicone rubber bulk material through the pollution layer to the surface. These then encapsulate any pollution particles, including salt.
Even if the polluted surface appears hydrophilic, part of the pollution layer is penetrated by LMW silicones and effective resistance increases. HT is defined as:

where ASDD is Apparent Salt Deposit Density (or localized ESDD). Both ESDD and ASDD are measured with a small cell filled with deionized water where the bottom is the surface of the polluted insulator. ASDD is measured initially as current through the cell when the encapsulated pollution has not yet dissolved. After 5 minutes, or when current has stabilized, the bottom surface of the cell is scraped with a glass rod to set any encapsulated pollution free. This is then the measure of ESDD.
This parameter provides a good indication of the ability of a composite insulator to recover under different environments. A compilation of HT values and their spread for different AC and DC silicone insulators is presented in Fig. 3 (high HT is considered > 0.5).
3. Rapid Flashover Procedure (to obtain dielectric strength of naturally polluted insulators)
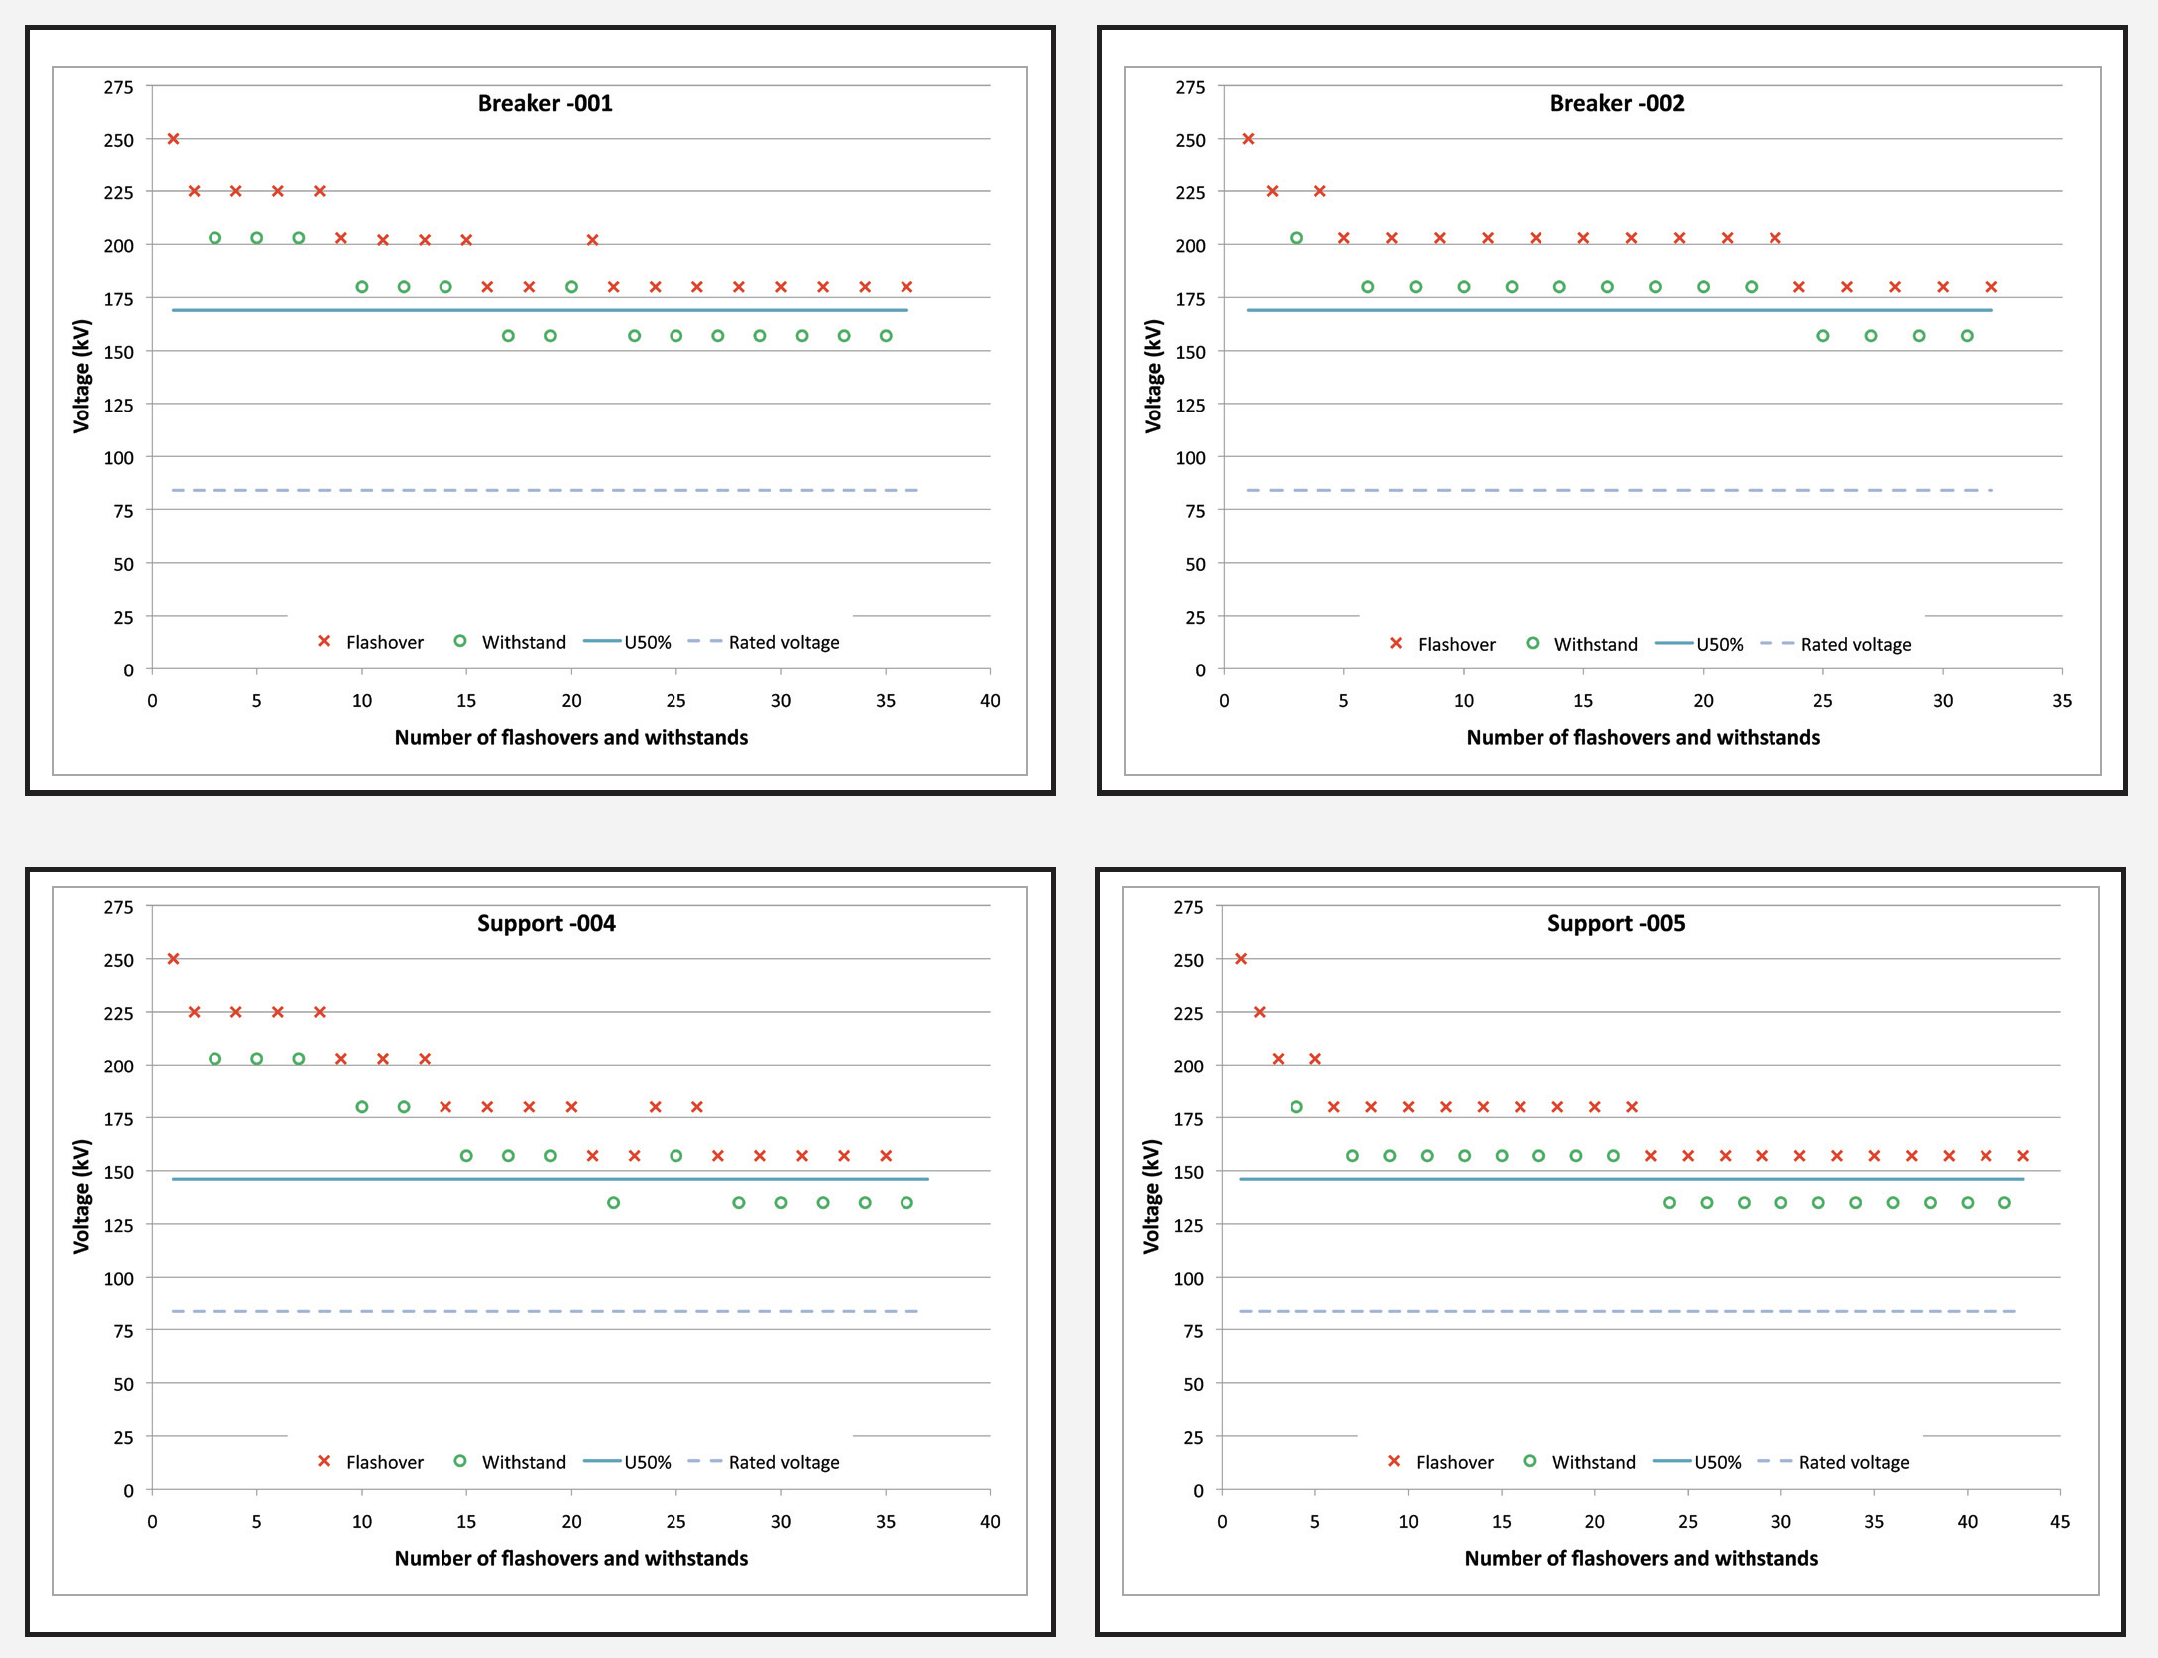
Because relatively few insulators with natural contamination are normally available from service, it would be time consuming to use the standard ‘up-and-down’ testing procedure to obtain flashover voltage. The rapid clean fog test method can then be used instead with the advantage that it is directly applicable to both naturally and artificially polluted insulators.

The insulator is tested by consecutive application of voltage until the minimum withstand voltage of the U-shaped curve is obtained. Flashover levels generally decrease before resistance of the insulator starts to increase due to the washing effect. The minimum voltage level obtained is then considered to represent U50%. As a result, only one test is required per insulator, level of pollution and degree of hydrophobicity.
This method is included in CIGRE Brochure 481 and has been successfully applied for testing:
• AC porcelain support insulators with industrial pollution;
• DC glass cap & pin insulators with light inland pollution;
• DC composite insulators with light marine pollution;
• DC composite insulators with light inland pollution;
• AC composite circuit breaker housings with heavy industrial/marine pollution.

This method can be applied to create pollution performance curves to be used in the STRI IST program, as was done for insulators replaced from the Skagerrak and Cabora Bassa DC overhead lines. It can also be used to quantify the ability of a composite insulator to recover hydrophobicity. Such methods were reviewed by a past CIGRE Working Group D1.44 ‘Testing of naturally polluted insulators’. The test’s excellent repeatability is illustrated by the results from two different naturally polluted insulators (see Fig. 4).
Summary
IEC 60815 requires accurate site severity evaluation performed over a minimum period of one year to identify the maximum stress level and corresponding site pollution severity (SPS) class. Such a process can then be defined as pollution monitoring and is the starting point in the process of selecting and dimensioning outdoor insulators for service in polluted areas. Although a software program called the Insulator Selection Tool follows the dimensioning process of IEC 60815 and has been verified against experience from the field, accurate pollution input data for this program is crucial. Among recent trends in pollution monitoring to generate such inputs are:
• Expanded application of simple, robust and reliable devices (e.g. dust deposit gauges and single-channel leakage current sensors);
• Novel as yet not standardized methods that take into account specific features of insulators (e.g. hydrophobicity transfer / localized ESDD in the case of composite insulators);
• ‘Smart’(time and cost-effective) methods to obtain flashover voltage of naturally polluted insulators, e.g. when only a few test objects are available (rapid procedures). These will be standardized in the future’
• Further development of specialized software programs for ultimate application by power companies (e.g. combining technical and economic issues in one program).