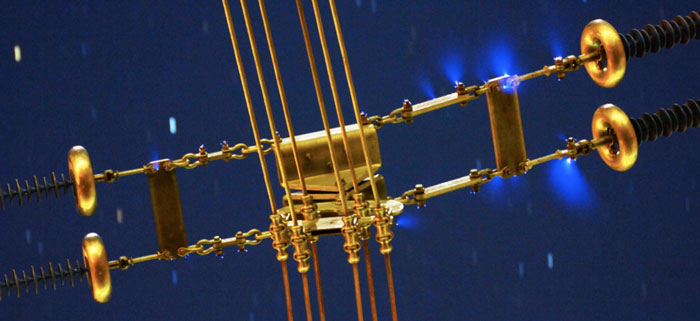
One of the most important parameters in the case of composite insulators is their intrinsic hydrophobicity, which allows superior performance compared to ceramic cap & pin strings. However, initial hydrophobic properties can deteriorate in service should there be continuous corona activity either directly on the housing or from nearby metal fittings. This can even become a specific mechanism leading to premature ageing and therefore has to be taken into account at the design stage. Electric field must always be controlled in vulnerable areas of these types of insulators.
This edited past contribution to INMR by Igor Gutman and Peter Sidenvall proposed an approach to optimize dimensioning of grading rings and also offered calculations and verification of that approach.
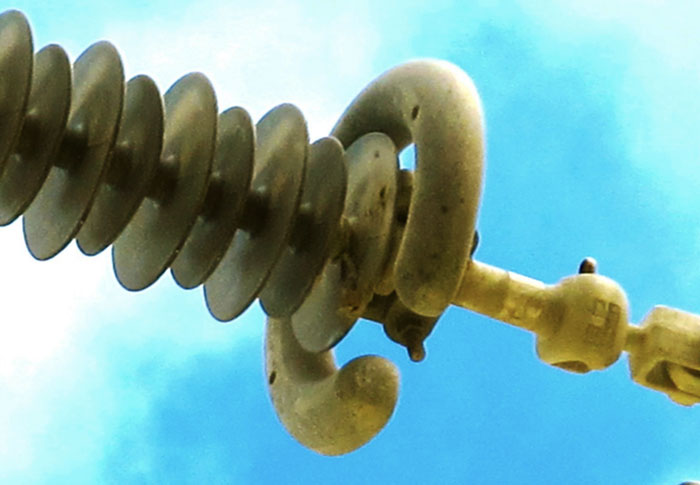
Although initially finding use primarily in polluted service areas, composite insulators have seen growing application in relatively clean environments as well due to their comparative ease of handling and attractive acquisition costs. More recently, voltage upgrading as well as compact design of new AC lines have become additional niche areas where composite insulators are being applied in clean environments. In the case of the latter applications, insulator arrangements are often designed relatively short to fit into the reduced space window of towers. Therefore, limiting maximum E-field becomes more critical still. Another growing area of application are composite station post insulators, especially those having a solid core since these do not differ much in flange design from composite line insulators.
Three criteria have to be taken into account to assure optimal dimensioning of composite insulators equipped with grading rings:
1. Limiting electric field on grading ring & end fitting;
2. Limiting electric field along surface of insulator housing;
3. Limiting electric field at ‘triple point’ (where air & housing meet metal fitting).
All three are normally verified by E-field calculations, the first by the standard RIV test described in IEC 60437 2nd Edition (1997-09). The third criterion cannot be verified by a test while the second is as yet not verifiable by any test. Power supply companies, however, are now increasingly interested in having such verification.
Establishment of Criteria for Maximum E-Field
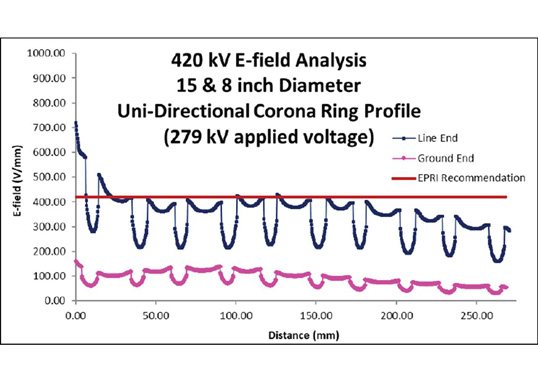
Until recently, there has been comparatively little data published on maximum permissible E-field in the case of composite insulators. According to past CIGRE Brochure 284, maximum E-field on the surface of a composite insulator (i.e. at the tip of the first shed from the end fitting) was estimated to be between 0.6 and 1.0 kV/mm. But this range was probably too optimistic. For example, earlier research by EPRI indicated that a maximum limit on E-field of 0.45 kV/mm was preferable while past research at STRI proposed 0.4 kV/mm. Others have estimated critical E-field level at only about 0.38 kV/mm.
For maximum E-field on the metal fitting, the CIGRE Brochure recommended a limit of 2.2 kV/mm. According to an earlier paper from EPRI, the value indicated for surface E-field on metal fittings and grading rings should be 2.1 kV/mm and this value is often being used as a reference for design purposes. According to internal past CIGRE discussions, however, some utilities are specifying values as low as 1.6 kV/mm – probably to account for possible manufacturing defects, surfaces that have become slightly damaged from improper handling or ageing of the grading rings in service. In an earlier paper, STRI had recommended 1.8 kV/mm.
Data from STRI & EPRI
Research summarized work carried out to determine a practical limit for permissible E-field on insulator surfaces for design purposes. Initial work by EPRI to determine E-field threshold levels for water-induced corona (first published in 1999) was expanded based on small as well as full-scale tests to refine these thresholds. For example, results from both natural ageing tests and artificial ageing tests showed clear tendency for reduced hydrophobicity on sheath sections where E-field exceeds about 0.3 to 0.4 kV/mm (see Fig. 1). Further fine-tuning of the threshold has been based on small-scale and full-scale laboratory tests as well as data from service experience. This led to the following final criterion, illustrated in Fig. 2: average E-field on the insulator sheath should not be permitted to exceed 0.42 kV/mm for more than 10 mm along the surface. Such an averaging approach was introduced to avoid small yet significant geometry issues, which do not properly reflect insulator performance (i.e. there will be a sharp increase in E-field at such points). As for the end fitting seal (i.e. the triple point), E-field must not be allowed to exceed 0.35 kV/mm. Calculations should be modelled using 3-D E-field simulations and laboratory testing can also be considered.
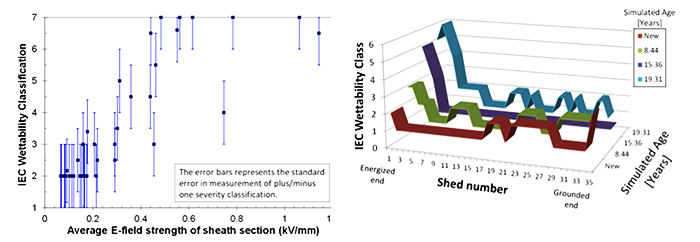
(left) STRI results after 8 years of natural ageing test in clean environment.
(right) EPRI results after full-scale 230 kV accelerated ageing test.
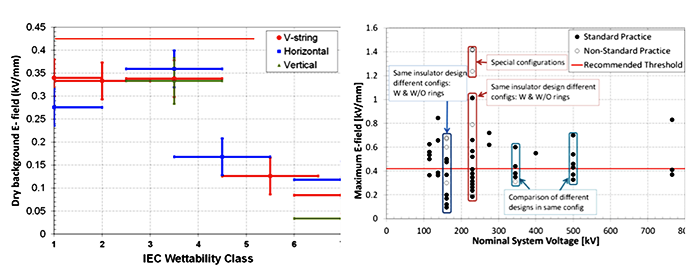
(left) STRI laboratory results showing E-field levels for continuous corona discharge from water sprayed on composite insulators with different hydrophobicity levels.
(right) EPRI results showing maximum E-field on sheaths of composite insulators for 61 in-service configurations and recommended limit of 0.42 kV/mm.
Finally, the following criteria were used for many practical applications:
* Limit of E-field on grading ring & end fitting: 1.8 kV/mm
* Limit of average E-field along housing surface: 0.42 kV/mm
* Limit of E-field at triple point: 0.35 kV/mm
Explanation of Approach
Program & Modelling
All calculations were performed using the Comsol Multiphysics software program. A practical example of such a calculation for real service conditions was as follows:
The insulator cross-arm model was fitted on the centre phase on one side of a tower (as in Fig. 6). The phases were arranged to simulate the worst-case scenario from an electric field point of view, i.e. the centre phase is exposed to the highest E-field due to proximity of the adjacent two phases on the same side of the tower. According to the requirement of the client, the voltage was set to Um=420 kV. The electric potential applied in the centre phase was therefore 420/√3 kV. Voltage on the two phases above and below the centre phase was 420/√3 kV with a 120° phase shift. Only 10 to 12 shed pairs are normally modelled, based on earlier experience with similar calculations, which showed that only those sheds closest to the fittings are exposed to the highest electric field. Making this assumption allowed modelling time to be reduced.
The two main materials taken into account for this calculation were air and silicone rubber. The dielectric constant (relative permittivity) used for the glass fibre rod is the same as for silicone, i.e. 3.0, but since actual relative permittivity is lower for silicone, the calculation is slightly conservative. The most important reason to simplify calculations in this manner is to make meshing easier and allow the calculations to run faster. Fig. 3 shows typical results.
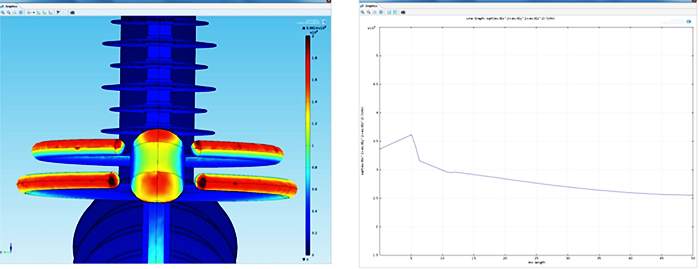
(left) Normal E-field at grading ring and arcing horn.
(right) Electric field along surface of housing.
A second practical example of application of the Comsol program was verifying that the laboratory arrangement in a particular test hall (using a specific maximum test voltage) actually simulated service conditions. Fig. 4 top left shows the laboratory set-up used for calculations and testing. The high voltage boundary used was 242.5 kV. Walls, floor, ceiling and equipment in the test hall were set to ground potential. A simulation of the same insulation arrangement was performed for comparison purposes in service conditions on a standard three-phase tower (see Fig. 4 top right). Using results obtained from these calculations, it was confirmed that corona would be initiated at approximately the same voltage in the test as in service (see Fig. 4 bottom), assuming a large enough laboratory.
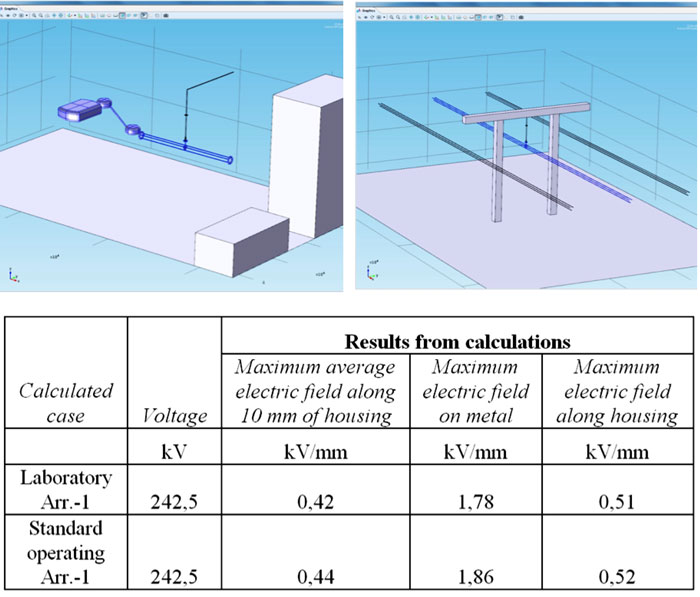
(top left) Laboratory arrangement; (top right) Service arrangement;
(bottom) Comparison of results.
Examples of Practical E-Field Calculations
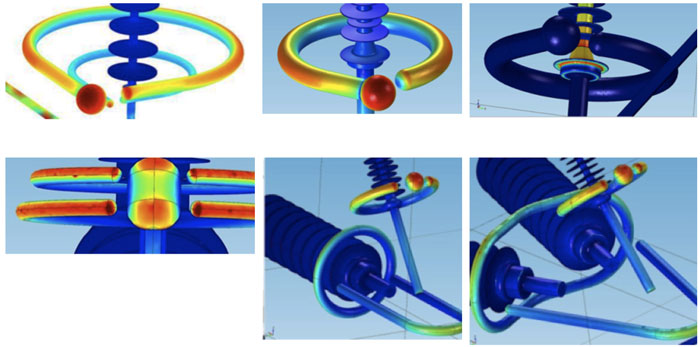
Using the above criteria as well as principles of calculation, a number of E-field calculations were performed for power companies (totalling over 20 design arrangements using composite insulators). These calculations involved both line and station post insulators and were intended to check the limits of E-field. In some cases, they were also used to make recommendations to optimize design and positioning of grading rings as well as arcing horns. Fig. 5 presents some of these results, later verified by field observations performed with a daylight UV-camera.
Comparison with Other E-Field Calculations
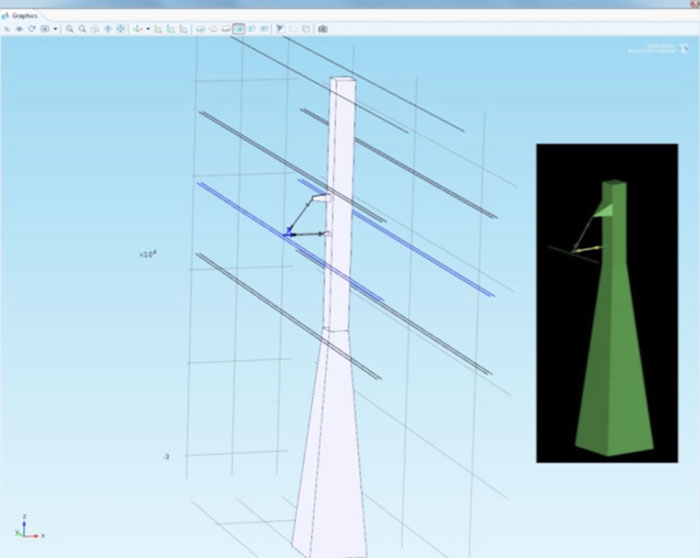
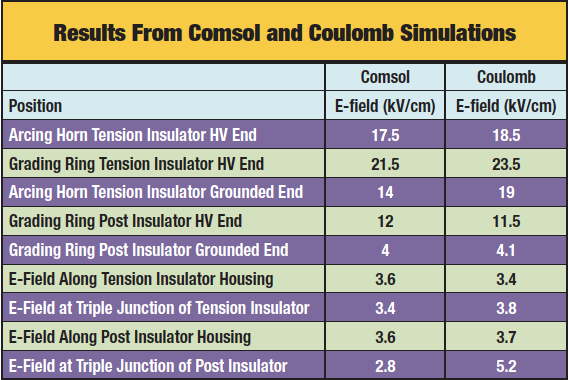
To verify results of the calculations, a case study was performed involving a complicated dual three-phase tower structure (with insulated cross-arm) and rather high AC voltage level (420 kV). Comparison of E-field calculations was performed using two different finite element analysis/boundary element (FEM/BEM) programs, i.e. Comsol Multiphysics and Coulomb 3D (see models in Fig. 6 and results in Fig. 7). The two different approaches for 3D E-field calculations ended with basically similar results for this complex insulation structure, meaning that the simplified method (Coulomb 3D) is a good start to evaluating the insulator and hardware. However, to better understand and optimize the complex design of an insulated cross-arm, all parameters of the surrounding three-phase conductors must be taken into account.
Development of Water Drop Corona Induced (WDCI) Test Methodology
Pre-Test on Short Insulators
Swedish TSO Svenska Kraftnät requested a test to verify the results of E-field calculations on the surface of composite insulators. The first challenge was to create a wetting method that properly simulates water drop corona but still allows the test to be performed without disturbance from other parts of the insulator. Standard IEC rain could be one good option but this created a lot of corona from the metal parts, thereby disturbing the focus of main interest, i.e. the surface close to the HV fitting. After some experimentation, the following points were concluded based on a pre-test using short insulators of about 52 kV voltage class:
• The most promising pattern of water drops for simulation and detection was a saturated surface with both large and small droplets (as shown in 8 left). This was produced by hand spraying, according to IEC TS 62073, with water of about 100 µS/cm standard conductivity.
• Water drop induced corona can be simulated, detected and documented at maximum operating voltage and even below this level (see 8 right).
Testing performed on short insulators provided a much better understanding of the mechanism of water drop corona and formed the basis to proceed with full-scale tests.
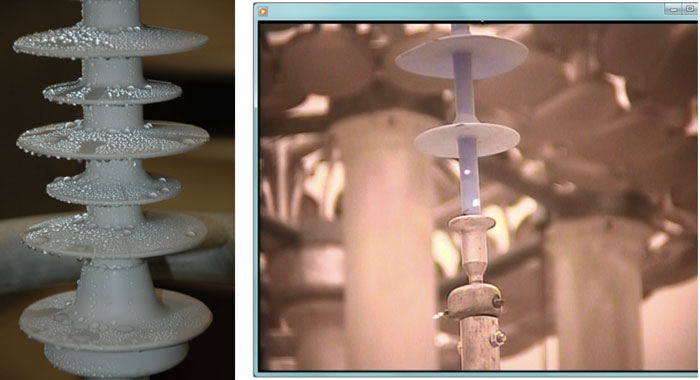
(left) Insulator covered by water drops produced by hand spray according to IEC TS 62073.
(right) Water drop corona observed by UV camera.
Full-Scale Testing on Different Insulator Designs
Full-scale (420 kV voltage class) testing was performed initially on one specific design. The intention was to find the most promising detection technique for documenting results, whether:
• Daylight UV-camera;
• High-speed camera with light amplification;
• RIV-measurement;
• PD-measurement;
• Acoustic measurement; or
• Still photography with long shutter time
After comprehensive testing, it was decided that still image documentation was the best option as far as ease of use (allowing repeatability and reproducibility) as well as analyzing results and defining acceptance criteria. It was also determined that it is important to document results with photos taken both from above and below the test object since corona could be hidden if viewed from only one direction (see Fig. 9).
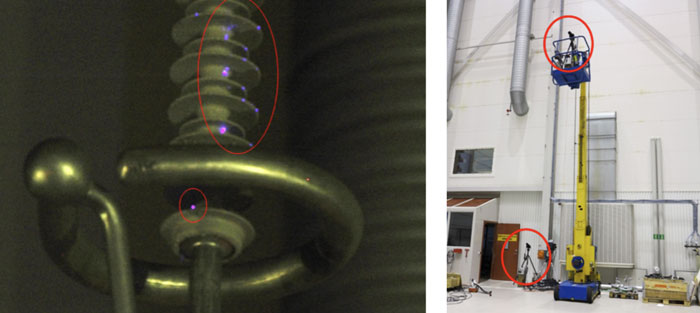
(left) Water drop corona documented by still camera with shutter time 30s.
(right) Example of two-height positioning of cameras (marked by red circles) during test.
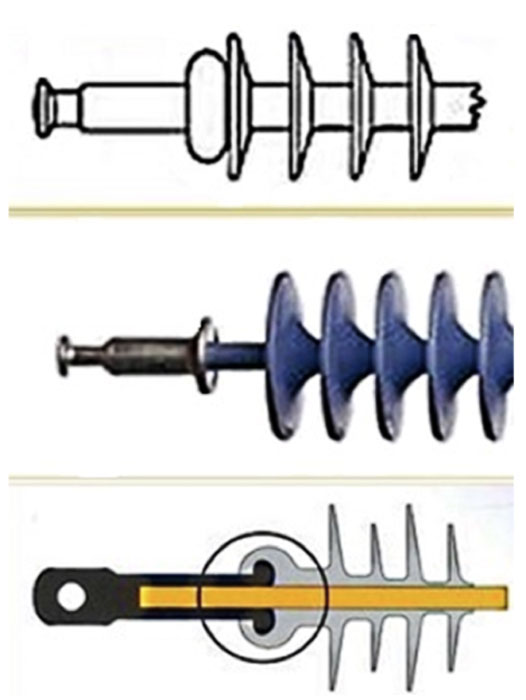
The preliminary test method developed and fine-tuned on a single composite insulator design was then verified on 3 different designs of end fittings (depicted in Fig. 10). The intention was to also refine the test criterion, taking into account possible ageing of the housing surface due to corona. Another issue was to fine-tune the desired range of humidity for the test.
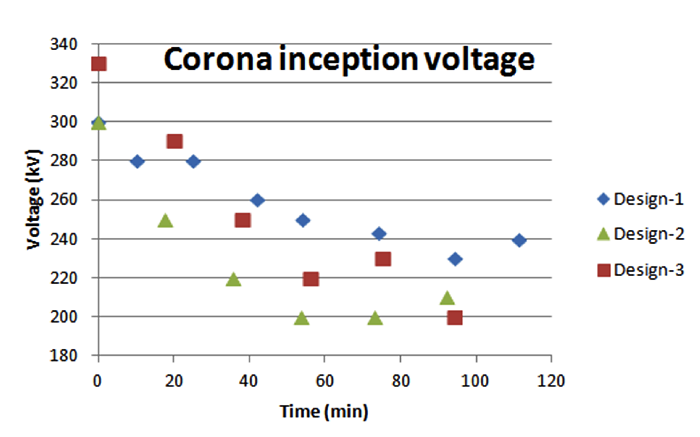
To evaluate ageing, corona inception voltage on the insulators was investigated after different periods of exposure (see decreasing corona inception voltage versus corona exposure time as per Fig. 11). Effective (i.e. actual) corona exposure time differs between the tests for different insulators. It is known that, when exposure time is longer or recovery time for hydrophobicity is shorter, hydrophobicity and corona inception voltage decrease more rapidly. This helps explain different gradients of decrease in inception levels over time for different insulators.
When E-field is sufficiently high to initiate water-induced corona, the surface starts to deteriorate and becomes more hydrophilic, as was clearly observed during the tests. It was also shown that when contact angle of droplets is reduced, the level of E-field needed to initiate corona also goes down (see Fig. 2 left). Thus, it was finally decided to establish the criterion for new insulators only, namely that no corona should occur at maximum operating voltage.
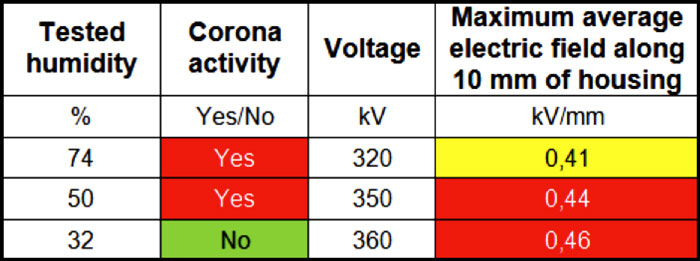
While investigating the influence of relative humidity (RH), it was discovered that corona inception voltage at different humidity levels deviated by more than 10%. The results of electric field calculations at different voltage and humidity levels (presented in Fig. 12) seem to correspond better with those laboratory observations at higher humidity levels. In fact, since air is humid when water droplets are applied to insulators in service (e.g. from rain, dew, etc.), it is reasonable to use a more humid range while performing the test. Thus, the appropriate RH range proposed for the standard RIV-tests seems to be 45 to 75%.
The first proposed approach for the criterion for visible corona was 75% of maximum operating voltage. Further development tests were performed to fine-tune the procedure of voltage application and, during these tests, observations of visible corona were compared to the results of E-field calculations. The procedure was as follows:
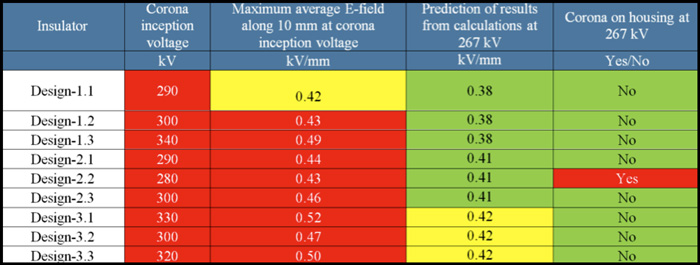
The voltage was increased until water induced corona could be detected on the surface of insulators and then the voltage was decreased to 110% of maximum operating voltage (267 kV). This voltage application procedure was applied to 9 new insulators (3 identical insulators of same design as in Fig. 10). The results of corona observation (red means observed, green means not observed) are presented in Fig. 13. This data is complemented by the results of E-field calculations at the same voltage levels. It is seen that the predictions based on E-field calculations are supported by appearance/absence of corona during the test. After fine-tuning, as discussed, this criterion was changed to 100% of maximum operating voltage (and it was also stated that the test is valid only for new insulators).
Results from Testing Complicated Insulation Structures
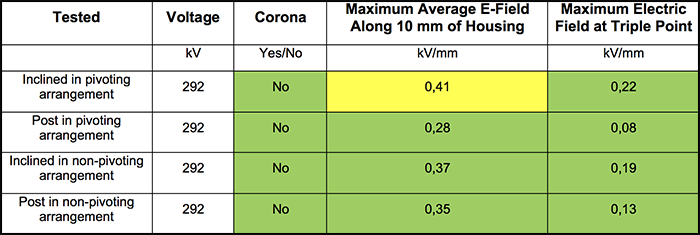
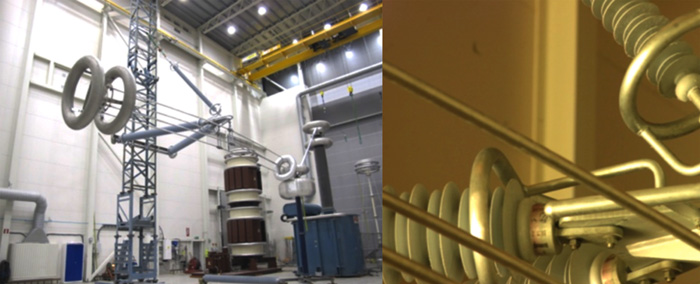
Thus far, only results on vertically installed insulators have been presented and discussed. However, one of the recent practical applications of the WDCI-test was for complicated structures using composite insulators. For example, the TSO in Belgium recently upgraded their double-circuit 150 kV transmission network into double-circuit 380 kV lines. The traverses were removed on affected towers and the insulators replaced with complex composite cross-arms. One of these designs went through the full-scale WDCI-test, described above. The acceptance criterion was that there should be no visible corona at 100% of maximum operating voltage. Results were positive and are presented in Figs. 14 and 15. Absence of corona was predicted by electric field calculations at both 243 kV and 292 kV and verified by test results (green marked areas confirm that no corona should be seen based on calculations and yellow marked areas indicate that corona might be observed). Similar results were found for the 420 kV full-scale, three-phase insulation structure used by National Grid in the U.K., as illustrated in Fig. 16, i.e. corona was not observed at maximum operating voltage.
Final Proposal for WDCI Test
The final Water Drop Corona Induced (WDCI) test procedure should be performed as follows:
1. Set-up & Environment
As per RIV-test (a tower simulation could be useful to make the test more representative of service conditions) using a brand new insulator. The environmental conditions should be according to IEC 60437.
2. Test Objects
Three insulators of same design. If all pass, the test is passed. If one fails, the test shall be repeated with 6 new insulators and if none fail, the test is passed. If more than one failed during the first test, the test fails.
3. Wetting Method
The wetting should be made by the spray bottle recommended for the wettability test according to IEC 62073 from a distance of circa 25 cm and for approximately 5s. All metallic parts should be properly dried with paper/cloth to make sure no water could initiate corona that masks the main test. Conductivity of the water should be as standard IEC rain, 100 µS/cm.
4. Voltage Application
The voltage should be applied similar to the RIV test, i.e. first should be increased to corona inception voltage (or, if reached first, 120% of maximum operating voltage) and then reduced to a target voltage of 100% of maximum operating voltage. The observation of visible corona should be done at these two voltage levels and the voltage should be kept for 60 seconds at each level in order to allow proper documentation using still cameras.
5. Detection Techniques
The observation of corona should be made by two standard photo cameras, installed in parallel, with 30s shutter time. It is important to document results with photos taken both from above and below the test object since the corona could be hidden from one of the directions.
6. Acceptance Criterion
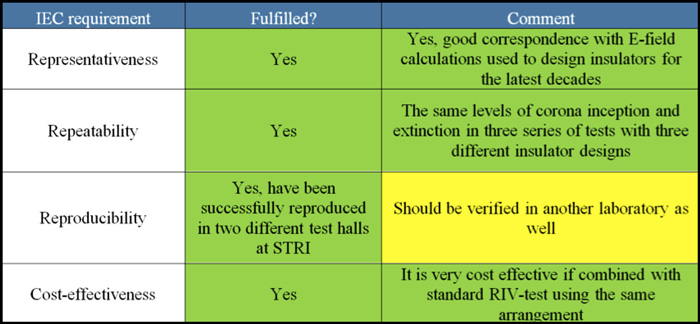
The proposed criterion is absence of visible corona at 100% of maximum operating voltage. The WDCI test fulfills most typical IEC requirements, as shown in 17.
Summary
Criteria for limitation of E-field in sensitive parts of a composite insulator have been established after comprehensive research by two teams but with basically the same numerical results. It is possible to verify the results of E-field calculations using the Water Drop Corona Induced (WDCI) test procedure, which fulfills most typical IEC requirements and is cost effective if performed in conjunction with standard RIV and/or corona testing. The test procedure can also be considered as an additional type test in any user’s specification for composite insulators. A combination of E-field calculations and verification by laboratory testing creates a solid basis for optimal dimensioning and positioning of grading rings and arcing horns on composite insulators.

