This report is an edited version of a recent contribution to INMR by Steve Aubertin of Goulden Reports in the United Kingdom. Goulden Reports is a well-established consultancy offering research and data to several industries, in particular suppliers of components and equipment for the power transmission and distribution sectors.
get_BG_listings category=”229″]
Present & Future Investment
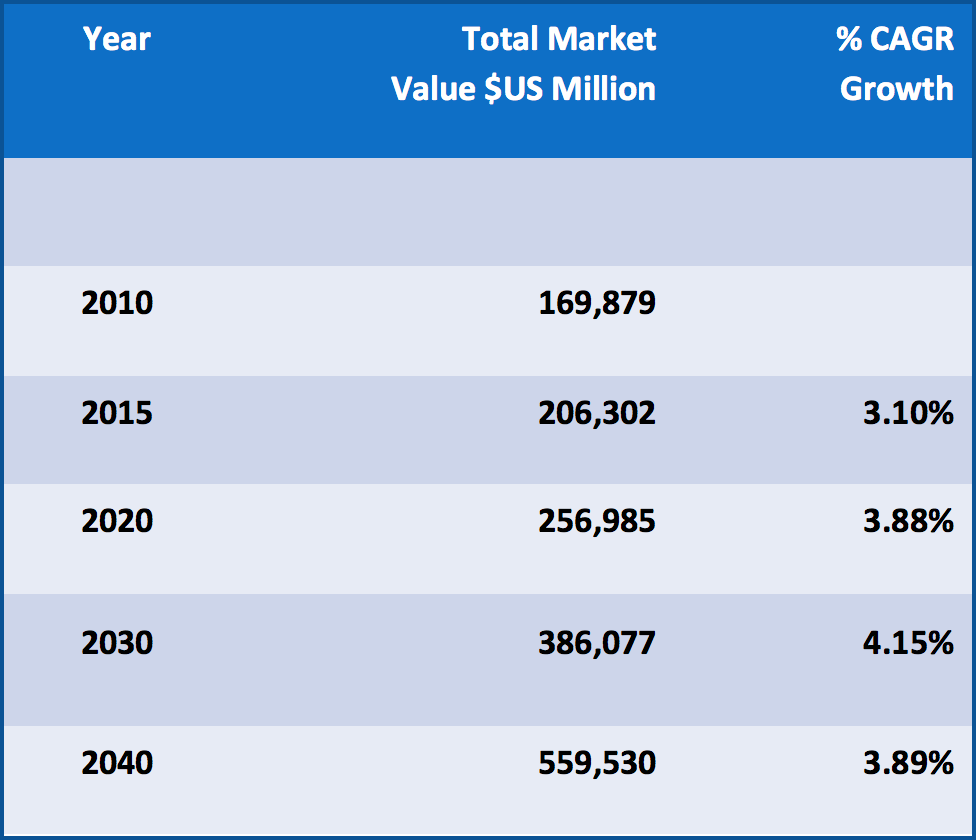
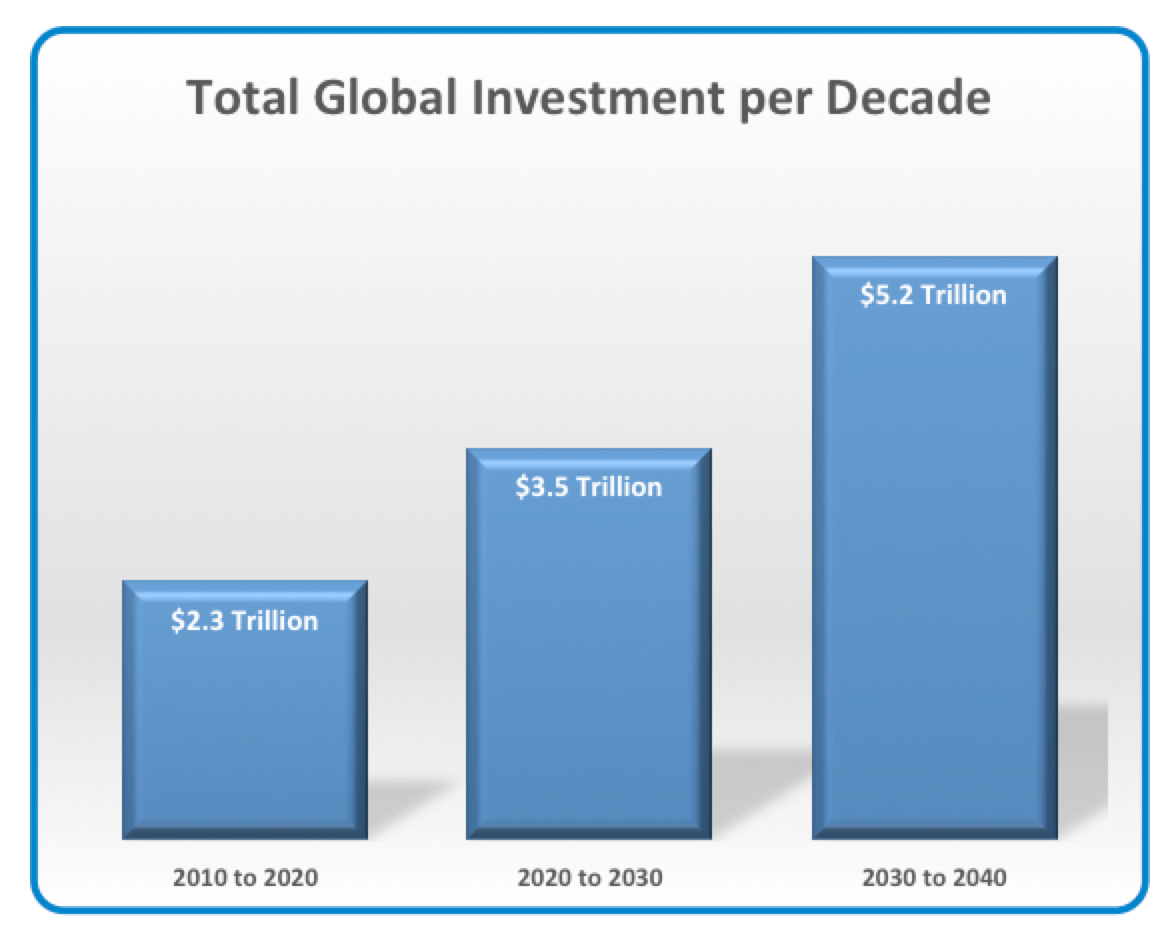
Global investment in transmission and distribution systems in 2019 was a little over $240 billion and by 2020 will have reached $250 billion. It is estimated that the compound annual growth rate (CAGR) over the next 10-year period will be 4.15%, meaning that investment by 2030 will be $386 billion (measured in 2019 US dollar values). Total investment in the decade 2010 to 2020 will be $2.3 trillion; even if the growth rates cools to half of those levels experienced since the 2008 crash, by 2040 annual investment will have reached $470 billion. Total investment between 2020 and 2030 will be on the order of $3.5 trillion and with a CAGR of about 2% between 2030 and 2040 will total $4.7 trillion.
CLICK TO ENLARGE
However, best estimates are that the period from 2030 to 2040 will show overall growth slowing to near 3.2% by 2040, yielding a total investment of $5.2 trillion during that decade.
CLICK TO ENLARGE
These sums are truly enormous. For example, investment between 2020 and 2030 will equal total German GDP in 2018 or the combined GDP of Italy and Canada. Then, over the following decade this will exceed the total Japanese GDP estimate for 2019. But growth will not be evenly distributed across the globe and the drivers in each region will also vary according to the development cycle in each. Grid development, enhancement, reinforcement, changes in the profile of generating facilities, demographic shifts and extra-territorial interconnections will all impact on markets and rates of development as of course will ability to pay for such development.
CLICK TO ENLARGE
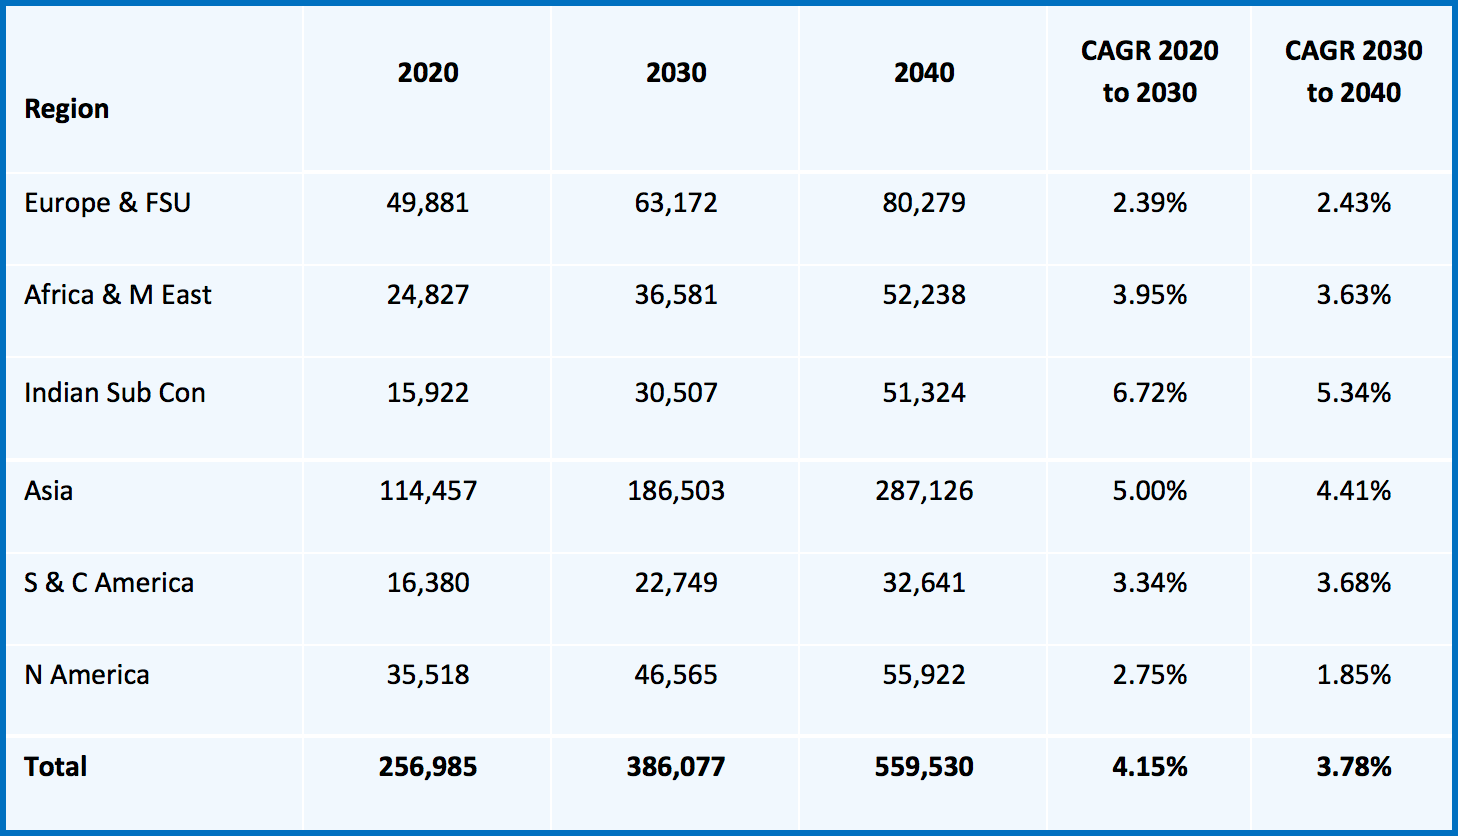
The global industry continues to be dominated by investment in Asia rising from 45% of the global investment in 2020 to over 51% in 2040 with CAGR of 5% during the first decade and 4.4% in the second period. The Indian sub-continent shows the highest CAGR of just less than 7% from 2020 to 2030 and over 5% from 2030 to 2040. However, total investment only increases from $15.9 billion to $51.3 billion during the first and second decade respectively. Europe and former Soviet Union (FSU) continue to invest at about 2 to 2.5% during the whole period but this masks the fact that Western Europe struggles to reach 2% CAGR and is ‘propped up’ by the FSU, showing over 3% during the whole period. Enhanced investment levels experienced in North America circa 2015 to 2030 will begin to fall away after 2030 to less than 2% during the last period.
Grid Development & Barriers to Growth
Who will fund that investment is the major question. The simple answer is that power consumers pay the bill at the end of the day – either directly or indirectly. In the early days of electrification in the 1900s electricity generation and distribution was developed on a local municipal basis, much as had the gas industry some years earlier. This was funded either by entrepreneurial capital, co-operative funding or town civil administration, the point being that in densely populated areas it was profitable to install a generator, cable to houses and sell electricity to the town inhabitants. Networks then radiated and expanded to include more consumers to a point where the population density fell and it no longer was economical to install distribution network for a few additional consumers. This was the nature of development in every industrialized nation including the U.S., U.K. and other European countries. As neighbouring communities expanded, their networks overlapped and the second wave of development began. Municipal companies merged, voltage levels increased, networks became more complex and rather than a radial topography extending along communication routes, proper grid networks were developed as recognized today. The problem that every country faced – and continues to face – was how to continue the electrification process into areas that will show no immediate return and make little economic sense.
Private Enterprise Model: The United States
It seems to have come as a great surprise to many during recent years that the U.S. grid structure has begun to deteriorate after years of rising load combined with lack of capital investment. Indeed, in a country where free enterprise and capitalism are at the root of every business, why would any corporation invest capital into unprofitable activities? Despite initial concerns evolving into dire warnings and eventually pleadings from reliability councils as well as policymakers, meaningful levels of investment have been slow to emerge. Various explanations have been put forward as to why this has happened including: lack of oversight; planning difficulties; strategic and routing issues; lack of regulation; and by contrast even too much regulation. But more fundamental structural issues have also impacted this sector. These days, the U.S. faces a number of challenges
• ageing infrastructure in general;
• congestion at the interstate level;
• changing power flows due to increased renewable generation.
Based on information compiled by the EIA and based on utility reporting to the Federal Energy Regulatory Commission (FERC) as filed by utilities representing about 70% of total U.S. load, those utilities together spent about $21 billion on capital additions in 2016, of which investment in transmission additions accounted for most utility transmission expenditures. In 2016, total transmission expenditures by utilities, included in FERC data, reached $35 billion with investment in transmission infrastructure making up 61% of that sum.
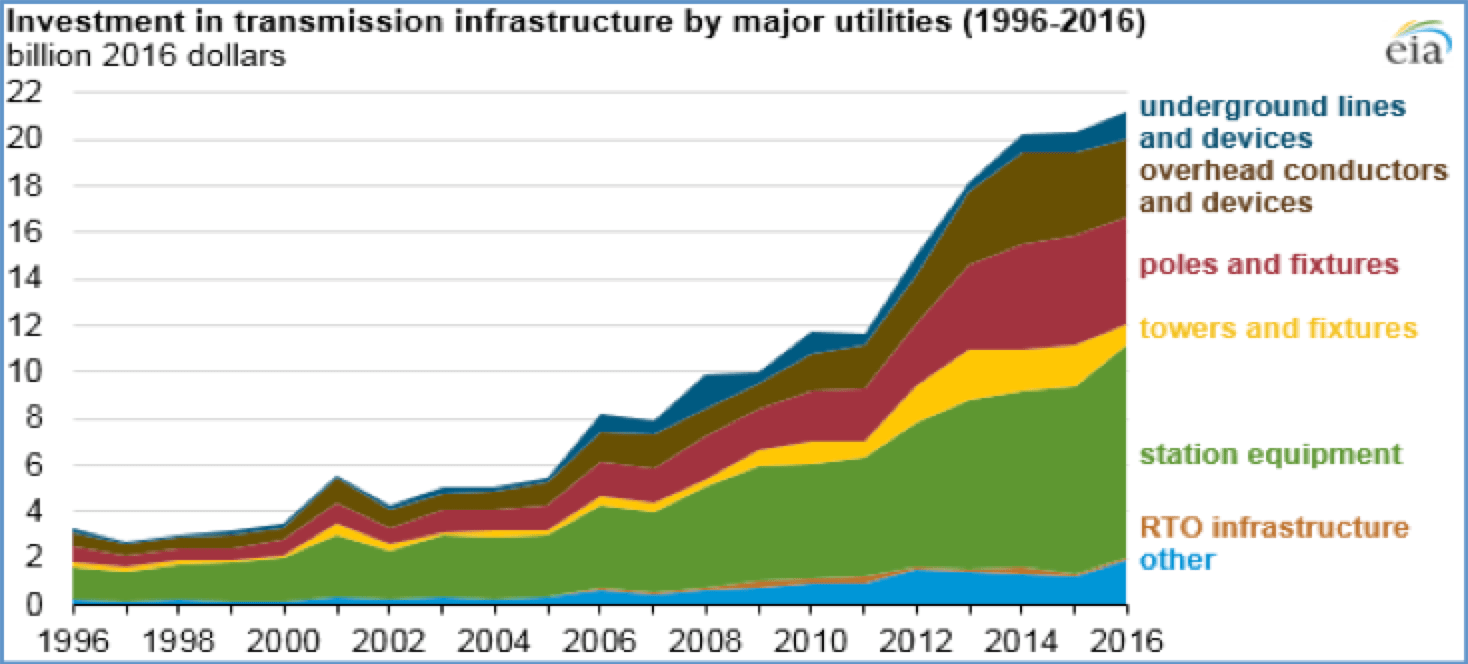
Source: U.S. Energy Information Administration, Federal Energy Regulatory Commission, accessed from eia website September 2018.
CLICK TO ENLARGE
CLICK TO ENLARGE
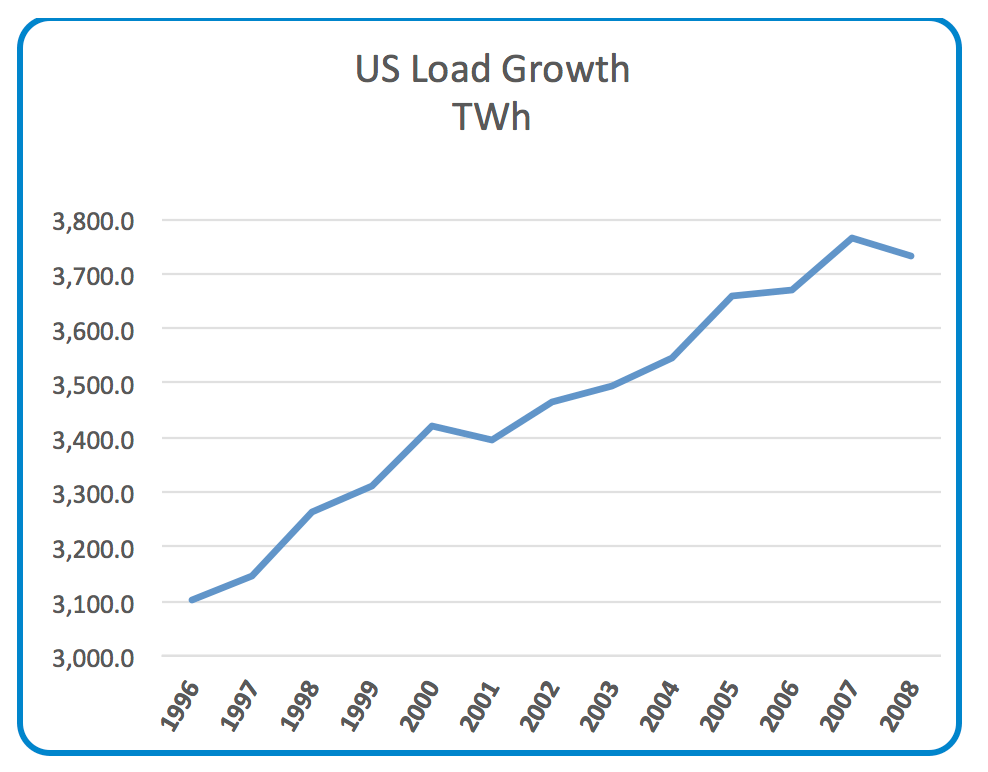
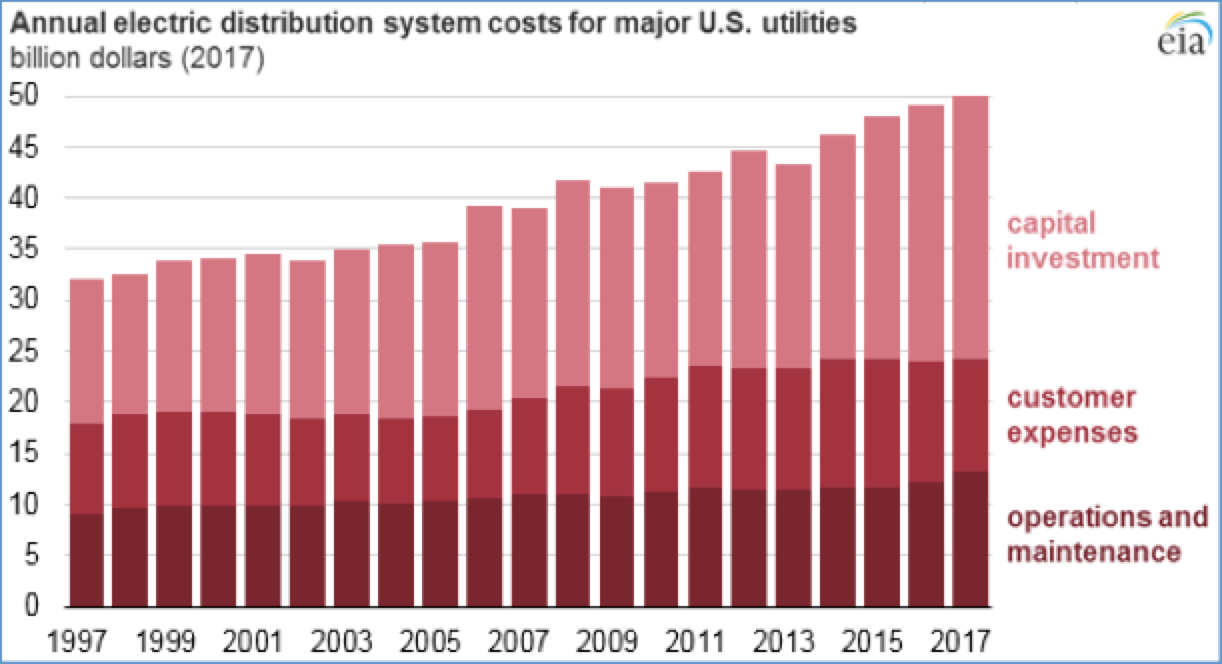
Comparison between Charts 1 and 2 clearly shows vast disparity between load growth and investment in transmission infrastructure. Capital investment accounts for the largest share of distribution costs as U.S. utilities work to replace ageing equipment. According to a 2015 Department of Energy report, “Quadrennial Technology Review 2015″ at the time 70% of power transformers were at least 25 years old, 60% of circuit breakers were 30 years or older and 70% of transmission lines were 25 years or older. Details of distribution costs (including capital investment) are shown below:
CLICK TO ENLARGE
Many estimates have been put forward as to the total spend that will be necessary to modernize the T&D network in the US and allow it to cope with the demands of decentralized generating facilities. The consensus appears to be that an average expenditure approaching $30 billion p.a. will be necessary over the next decade and maybe up to as far as 2040. This is referred to as the ‘next investment cycle’ but should more properly be referred to as the ‘catch-up’ due to decades of under-investment. It should not come as a surprise that something was not right. A glance at the shape of the curves in the charts above shows the differences between them. Transmission investment did not rise above $6 billion in any year before 2006 and did not get above $12 billion until 2011. Similarly, capital investment in the distribution network which was running at about $14 billion per annum for the previous decade and did not breach the $20 billion mark until 2008. Installed generating capacity, meanwhile, grew at over 5.0% CAGR up to 1990, at nearly 2.0% CAGR over the period 1990 to 2010 and at 2.5% between 2000 and 2010.
There will always be some delay between generating capacity, load growth and capability of the grid to transmit and distribute the generated electricity and indeed in the other direction when reserve generating capacity is compromised by peak demand. But the ramifications of turning on and off the investment tap are far reaching. A power transformer fleet of which 70% are more than 25 years old impacts and has impacted the manufacturing industry.
The European Experience
As noted, most European countries in the post 1945 era opted for direct government involvement in order to complete development of a national grid system. This aided smoother development during the early years of grid expansion. In the U.K., for example, this industry was nationalized in 1948 but then gradually privatized during the 1990s. The National Grid was established in 1990 and, its predecessor, the CEGB was not formally dissolved until 2001.
CLICK TO ENLARGE
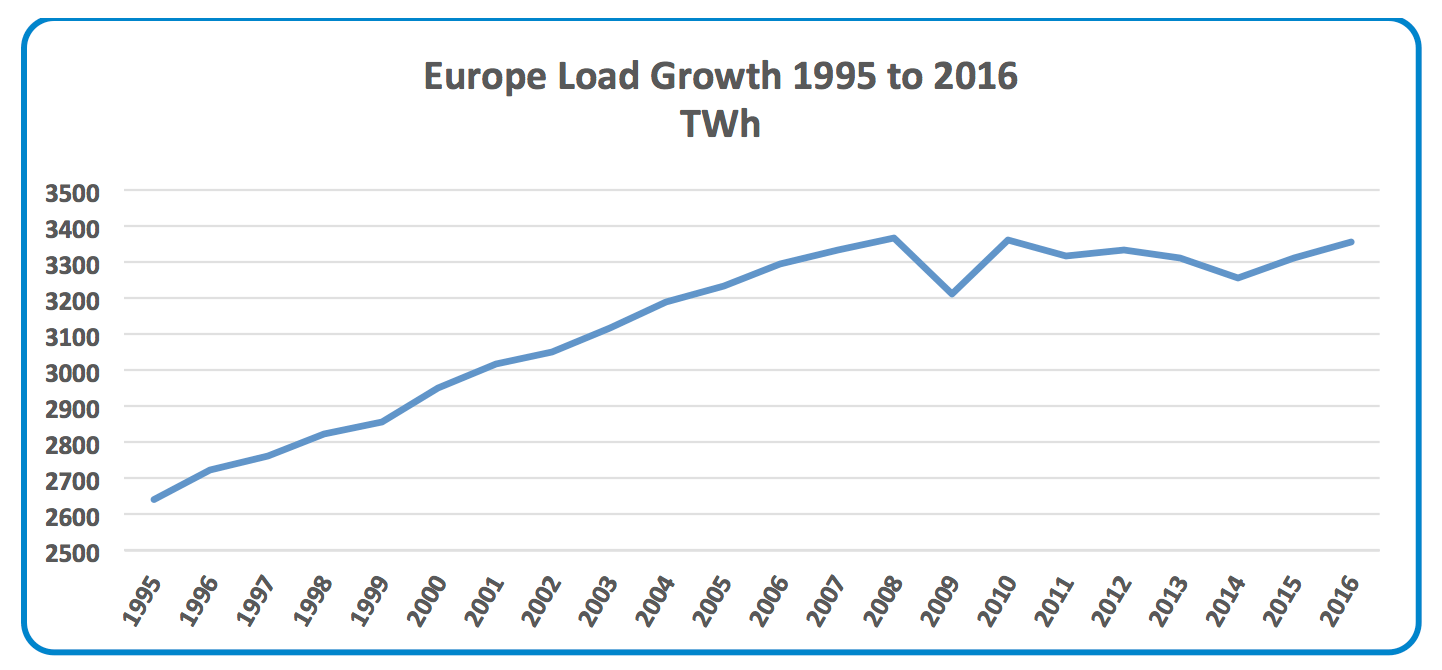
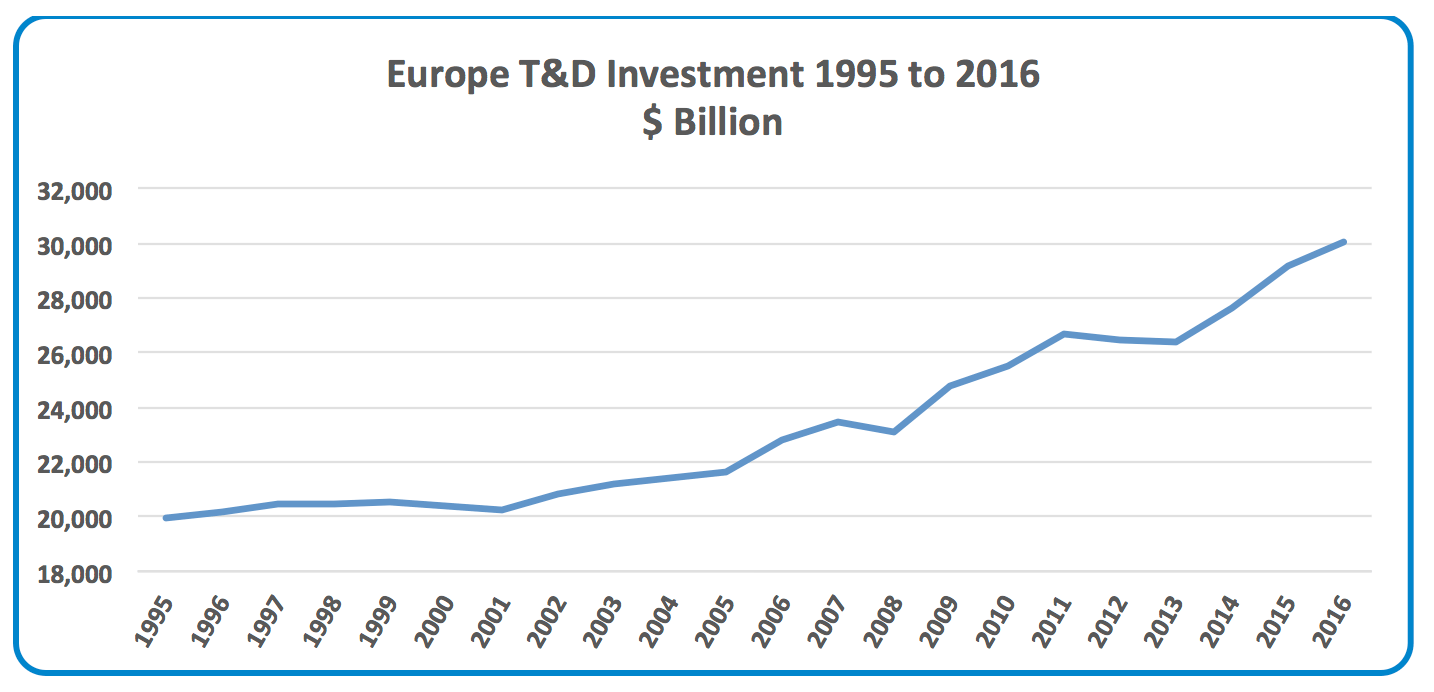
Load growth in Europe has been at a CAGR rate of 0.33% from 1995 to 2005, 2.64% from 2000 to 2010 and a2.6% between 2010 and 2020. Investment in T&D across Europe has increased by 0.8% CAGR between 1995 and 2005, by 2.28% between 2000 and 2010 and by 2.48% between 2010 and 2020. Rates that closely follow these load increase across the region.
CLICK TO ENLARGE
It is worth noting that the first directive from the European Union starting the process of electricity market liberalization was in 1996. Progress has since been slow and uneven. Most countries have accepted the principal of competitive privately-owned and operated generating companies and a grid operated by one or several Transmission System Operators (TSOs) – ensuring equal access to the grid network for competing generators, distributors and other customers. However the question of private company ownership of the grid is not universally accepted throughout the 28-nation bloc. The U.K. and Germany, for example, have largely accepted the fact that a privately owned, operated and maintained grid can work – albeit in a heavily regulated manner. Other countries, such as Norway, Sweden, Finland and Denmark, by contrast, participate in a pool system partly owned and operated by four privatized TSOs, although most share capital is still in State hands. France has ‘privatized’ EDF and the subsidiary TSO, RTE, but share capital is still 83.7% government-owned. This list goes on to Portugal, Spain, Italy, Greece, etc., that have all continued with State ownership of the TSO grid company. In these countries, financing for expansion and adequacy of the national grid system has remained since inception of government activity. The overall issue is that much of grid development throughout Europe over the period 1960 to 2015 has been completed within government control and financing arrangements.
As each country developed into this century, the emphasis was mostly introspective. Still, countries gradually increased their dependence on exchanges of power to augment and balance national requirements. Greater international cooperation and coordination was required and, in 2008, ENTSO-E (the European Network of Transmission System Operators for Electricity) was formed. The stated aim was:
ENTSO-E, the European Network of Transmission System Operators, represents 43 electricity transmission system operators (TSOs) from 36 countries across Europe. ENTSO-E was established and given legal mandates by the EU’s Third Legislative Package for the Internal Energy Market in 2009, which aims at further liberalizing the gas and electricity markets in the EU.
In practice, ENTSO helps coordinate development plans, collects and collates market data and guides individual TSOs in policy formation. It is noteworthy that, while the EU comprises 28 nation States and ENTSO-E has 36 country members and aims to liberalize markets, a glance at the 46 organisations on the membership list shows that the majority are still not privatized.
The Chinese Experience
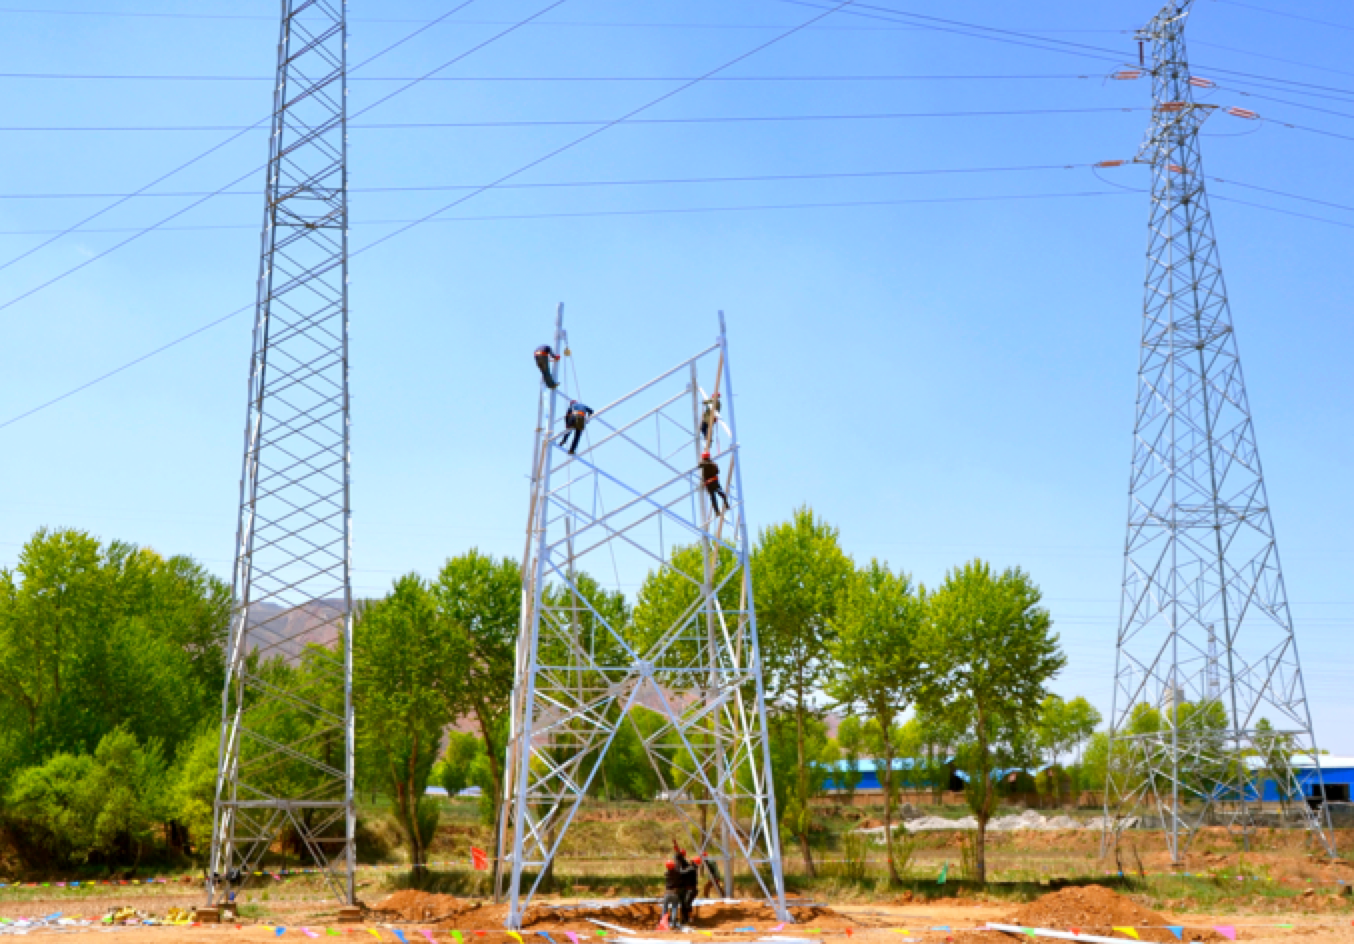
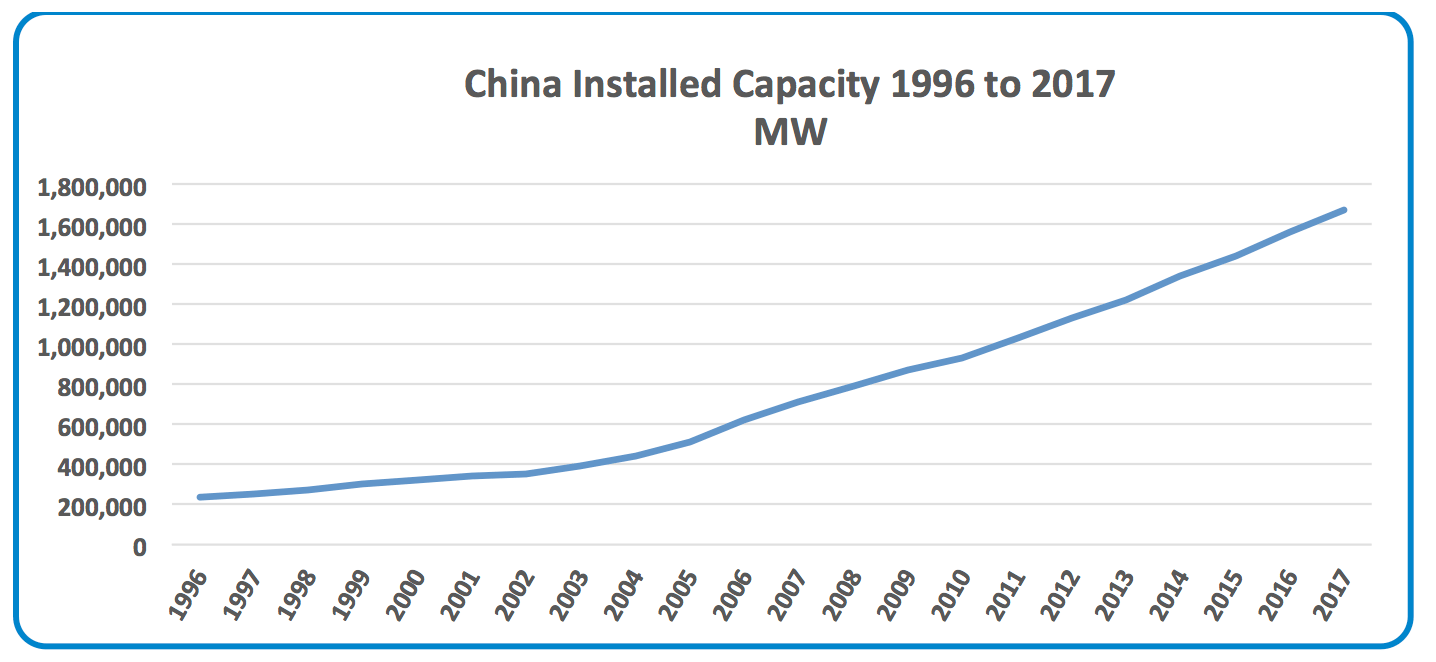
The State Grid Corporation of China, the SGCC, was formed in 2002 with the primary objective of bringing about the electrification and development of the T&D sector in at least 90% of the country, eventually supplying 1.1 billion people with a nearly 1 million km network. In 1996, the country had an installed capacity of 218 GW – on a par with Japan, twice the size of Canada but only a third of the size of the U.S. Once the SGCC was created, this had increased to 50% larger than Japan, three times the size of Canada and half the size of the U.S. By 2010, parity was achieved with the U.S. and by 2018 installed capacity was 40% larger.
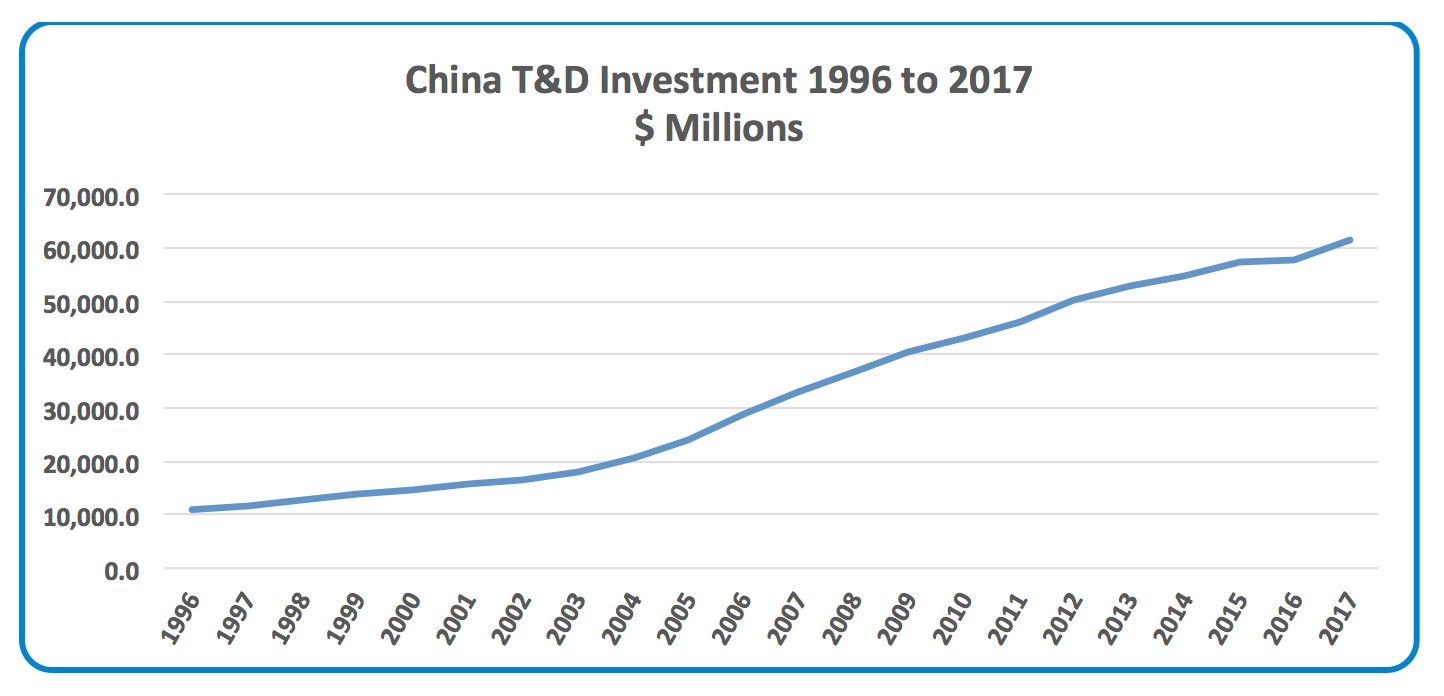
The two charts below show the close correlation between installed capacity growth and investment in the T&D network. This could only be achieved by a state-backed monopolistic (strictly speaking a duopoly since the China Southern Power Grid operates in the south of the country but is a fraction of the size of SGCC). One of the major advancements that China has made is regional interconnection and extension of the national grid to cover the entire country. With no need to worry about return for investors or about who will manage planning, everything becomes possible.
CLICK TO ENLARGE
Installed capacity in China increased by 9.04% CAGR between 1995 and 2005, 11.33% between 2000 and 2010 and at 7.94% between 2010 and 2020. Chinese investment in T&D similarly increased at 11% CAGR between 2000 and 2010, at 9.13% between 2005 and 2015 and at 5.38% between 2010 and 2020. Similar rates apply to increases in installed capacity.
CLICK TO ENLARGE
Conclusions & Future Prospects
There are many similarities in the role ENTSO-E plays in Europe, the role of the SGCC in China and that of FERC in the United States. These three ‘Blocs’ have ended up, at the same point in time, with broadly similar networks and facing similar future challenges. It could be argued that the Europeans have perhaps followed a smoother path, inasmuch as there have been no catastrophic outages. Moreover, Europeans have a generally newer grid and have also better supported their manufacturing base. The Chinese have probably faired best in all respects, having had the advantage of starting later, learning from the experience of others and being managed by one national government.
Looking to the future, the next development stage has yet to unfold. Investment is now taking place in the U.S. and at unprecedented levels. Meanwhile, in Europe, where there is a regulated environment and limitations are placed on the returns of TSOs, these rules are being relaxed in order to allow large capital projects to move forward.
Manufacturers, by and large, have paid a price for the ‘stop-start’ investment cycles. The U.S. had 2 of the largest companies in the electrical equipment sector – Westinghouse and GE – but since the 1980s one has effectively departed and the other, which almost exited the T&D markets altogether, has only recently returned. The implications are wider: statistics mentioned earlier suggest that only 30% of the transformer fleet in the U.S. has been installed since 1990 when George H.W. Bush was one year into his Presidency. Furthermore the lack of orders for large transformers resulted in the U.S. losing the ability to supply these machines such that by 2010 most were imported. The situation has since improved somewhat but it is noteworthy that the first three plants in the U.S. to produce these were built by EFACEC of Portugal, Hyundai of South Korea and Japanese giant Mitsubishi.
In the U.K., the CEGB attempted to keep three companies going to ensure competitive tenders for equipment. The result was that none was large enough to survive. The French government followed a one specialist for each product approach – Schneider continues in the MV sector but ultimately GE benefitted from the acquisition of HV specialist Alstom T&D. ABB became the largest in Europe and the rest of the world until its divestment to Hitachi and only Siemens remains among the Europeans. Japanese companies have all undergone individual challenges and will soon have to deal with the emerging new giants from China.
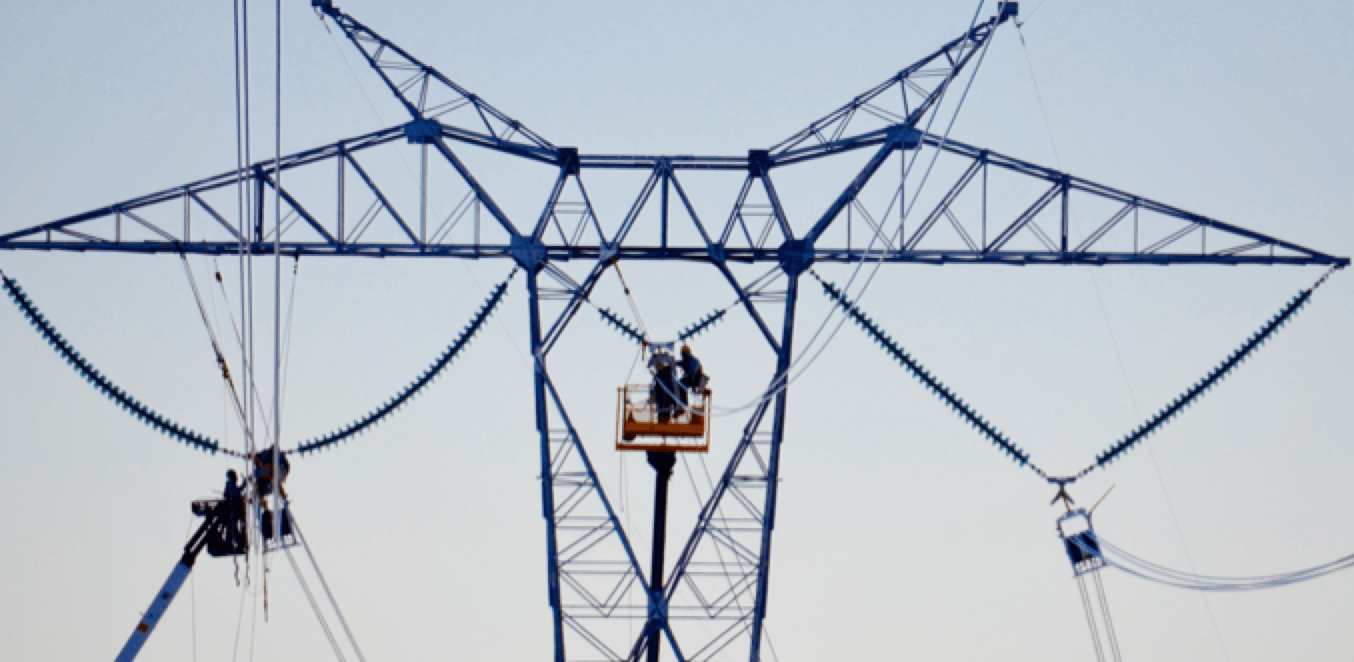
In the end, one of the most important aspects of this industry’s future development will be how is the T&D investment is organized and how investment spikes are smoothed to provide a continuous stream of business for the manufacturing sector. The number of companies capable of supplying the equipment necessary is decreasing and there have been casualties over the last few decades. Yet there is still sufficient business for all. More than 60% of the investment figures quoted in this article are for equipment and hardware and the demand and supply equation will have to be carefully managed in order to ensure future security in electricity supply.
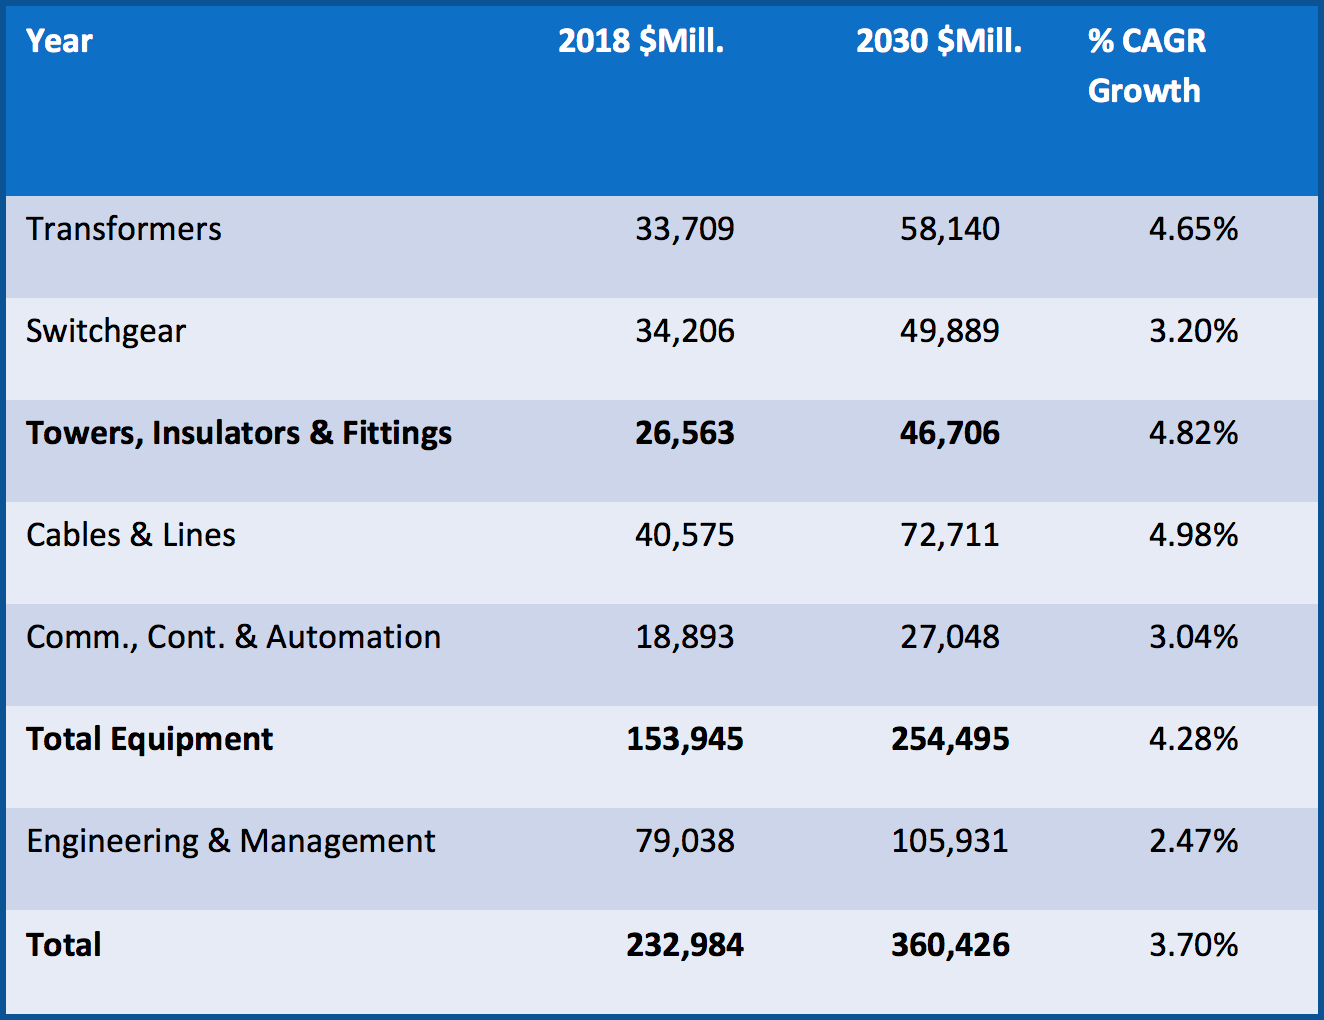
CLICK TO ENLARGE
As can be seen from Table 4 the total equipment bill of parts accounts for over 60% of the total spend. The segment that I believe will be of most interest to the delegates here today is that highlighted in red. The hardware that is worth in the order of $26 billion today and is forecast to grow at 4.82% through to 2028.

CLICK TO ENLARGE
The T&D investment as a percentage of the global total changes over time. The most dramatic shift is that by 2030 Asia will account for over 48% of the global investment and hence demand for equipment and that by 2040 over half of the total global demand will come from Asia.
Following the crash of 2008 governments have found it difficult enough to balance their books without providing additional help for infrastructure development. Some have even been asked to think the unthinkable and raise capital by selling state owned assets – mortgaging the future so to speak.

