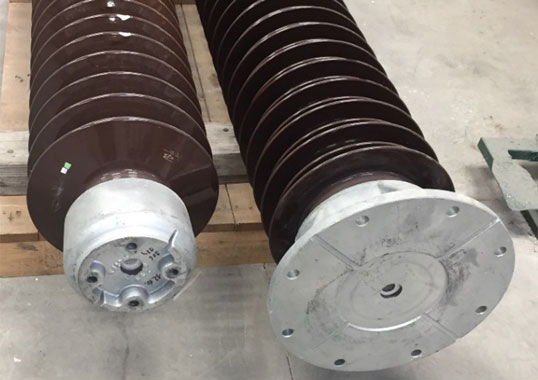
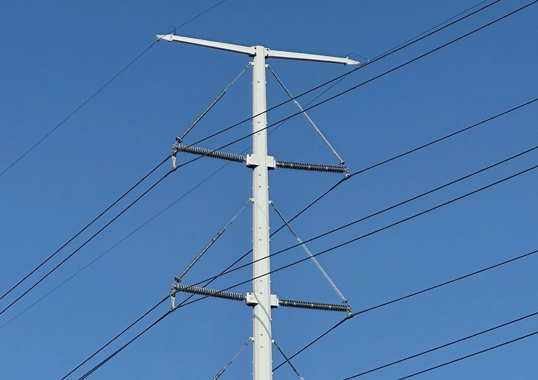
Statnett, the TSO in Norway, reinforced the electrical transmission grid in the country’s southwest due to a new HVDC submarine cable connection to Germany. The project consisted of 250 km of new transmission lines, voltage upgrading of 60 km of existing transmission lines as well as several new substations. The biggest challenge was construction of the new 525 HVDC NordLink Line, which is a part of the interconnection with a submarine cable. This new HVDC line is a 53 km bipolar triplex bundle line connecting to the 500 km submarine cable.
This edited past contribution to INMR by engineers Bjarni Helgi Thorsteinsson and Kjell Halsan of Statnett reviewed engineering challenges faced during design and construction of the line. Main focus is placed on what was done in regard to dimensioning the composite insulators selected aand also work to prevent damage from mishandling and transportation of the insulators.
The HVDC line shares a corridor for 38 km with two existing AC lines – a new 420 kV line under construction and an old 300 kV line being upgraded to 420 kV. The new line also shares the corridor with an existing 300 kV AC line for 5 km from the cable transition station. Fig. 1 shows the tower types in this hybrid corridor.
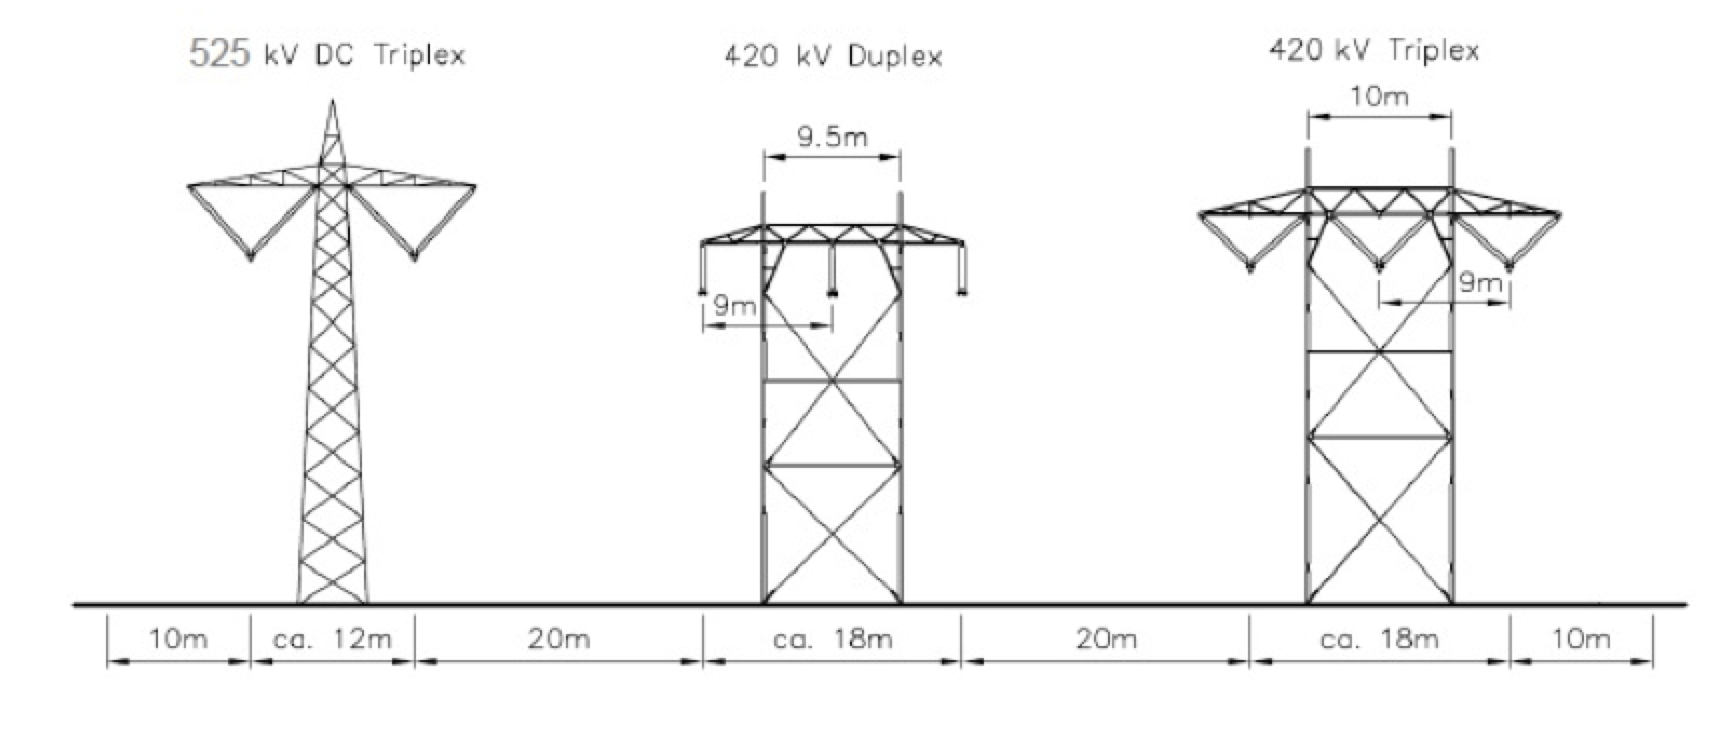
Statnett developed new towers for the HVDC line made using circular hollow steel profiles. In addition, all fittings were developed and full scale tested to be corona free at 20% above operating voltage, i.e. 630 kV DC. Spark gap strings for lightning protection of the cable have also been under development and testing.
Selection & Design of Insulators
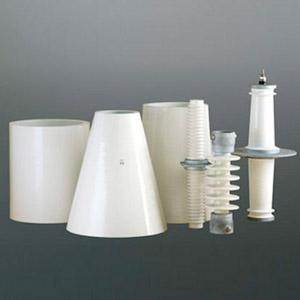
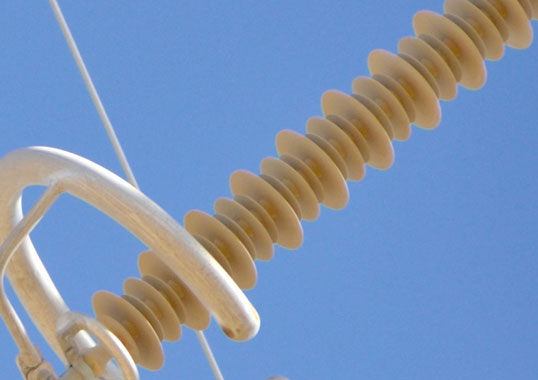
Composite insulators were chosen due to their increased pollution performance per unit length compared to glass insulators, the type used traditionally on most transmission lines in Norway. Since DC voltage requires greater ground clearance than standard 420 kV AC lines, it is important to have insulators that are as short as possible. This contribues to reduced tower height and width, without sacrificing electrical performance. Statnett has more than 15 years’ positive experience with composite insulators on an existing 250/350 kV HVDC line connecting to a submarine cable to Denmark. This line, constructed in 1976, originally was equipped with glass insulators but these were replaced with composite types after about 30 years due to an increasing rate of self-shattering. During the past 15 years, insulators from 5 different composite insulator manufacturers were installed at different locations to assess comparative impact of ageing. These insulators were monitored during operation and later taken down for thorough inspection. Due to positive results from these tests, it was finally decided to use composite insulators for the new DC line.
Pollution Measurements
Several steps were taken to find an optimal electrical design and length for the composite insulators. The line route goes through both coastal and inland terrain and it was necessary to measure pollution levels in both areas. This was done with Dust Deposit Density Gauges (DDDGs) installed along the line route. The first was installed on the coastal side of the line close to the cable transition station. The second and third gauges where installed 5 and 15 km further inland. DDDGs collect dust particles and rain carried by the wind in four open cylinders placed in all directions of the compass.
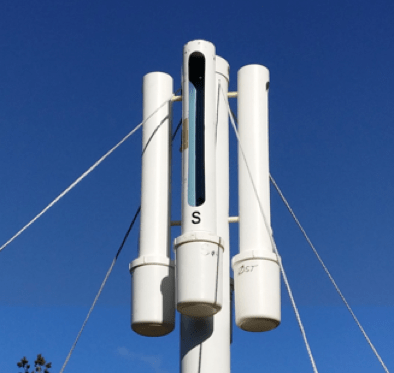
Measurements were performed over one year, with cylinders emptied once each month and water conductivity measured. Conductivity measurements were then converted to equivalent salt deposit density (ESDD). The ESDD values, along with IEC 60815, give an indication of pollution severity along the line route. But since this standard covers only AC lines, conversion to DC was necessary. Fig. 2 shows results of these DDDG measurements after a year.
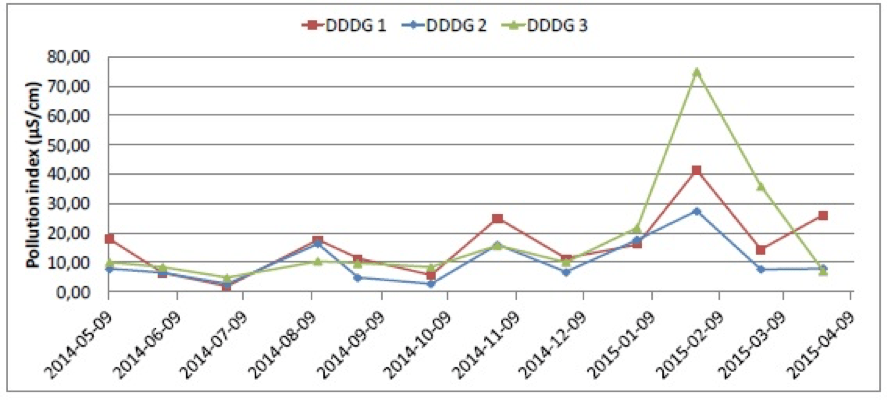
Fig. 2 shows that the pollution levels for all sites is in the light pollution category. However, it was interesting that the DDDG #3, which was installed furthest inland, had the highest measured pollution in a month – – not the coastal unit as would be expected. This is because there is an area of dense forest close to the cable transition station where DDDG #1 was sited. To a certain degree, this shielded the measuring device and impacted the amount of precipitation collected. DDDG #2 was placed in a similar environment on the side of a hill with trees in close proximity. DDDG #3 had full exposure to wind since it was placed on top of a hill with few trees nearby. This experience demonstrated that is important to evaluate the terrain and vegetation in close proximity to DDDGs and assess what possible effect this might have on pollution measurements. To evaluate the ESDD for DC, the following methods were used:
• Assessing environment as per IEC 60815-1;
• Service experience of AC lines in the vicinity;
• DDDG measurements;
• Wind and precipitation models.
Pollution analysis and measurements where done with the help of STRI, which also provided recommendations for insulator design and specific creepage distance, as shown in Table 1 based on the above methods.
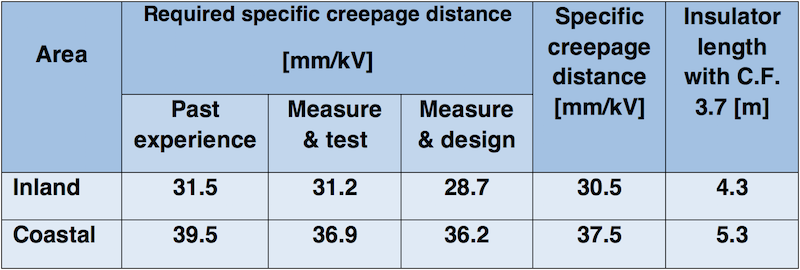
It was originally planned to use two different insulator lengths – one for the coastal area defined as the first 10 km and the other for areas further inland. However, due to the uncertainties in DDDG measurements as well as Statnett’s aim to standardize on one composite insulator length, the longer insulator i.e. 5.3 m without end fittings, was chosen for the entire line. This was seen as the more conservative and safer choice for the new line. It was also necessary to conduct pollution and ice accretion tests on the insulator selected to validate that the design was correct. The insulator manufacturer was invited to propose an alternative insulator profile to be tested alongside insulators previously selected. As such, two different insulator profiles were tested for pollution performance. The first had the same profile as the coastal insulator in Table 1 and the other was the profile proposed by the manufacturer, given some restrictions on electrical properties. These restrictions were that the insulator could not be longer than 6.2 m with end fittings, to fulfil the requirement based on designed tower cross-arm width. The creepage distance could not be less than 37.5 mm/kV. Comparison of the electrical properties of these two designs is shown in Table 2, with the greatest difference between the two being in shed spacing and number of sheds.

Design 1 and 2 were tested for pollution performance. The insulator that demonstrated better pollution performance would then be tested for ice accretion. The insulator that showed the best performance in both the pollution and ice accretion tests was ultimately chosen for the DC line.
Pollution Tests
In order to test, compare and evaluate the pollution performance of the insulators, Statnett and STRI developed a test program that consists of the Rapid Flashover Clean Fog Test Method as well as a Full Scale Pollution Withstand Voltage Test. Two insulator designs were tested. In addition, two short insulator samples of 1.5 m were also used in the rapid flashover tests in order to be more time efficient. Full length insulators were used for the full scale withstand tests while the 1.5 m scaled down insulators were only used in the Rapid Flashover Test. Table 3 shows the insulator parameters for both short and full length insulators.

Rapid Flashover Test
For the Rapid Flashover Clean Fog Test, insulators were cleaned and coated with a kaolin powder to mask their inherent hydrophobicity. The insulators were then contaminated with polluted water to achieve the desired salt deposit density and subsequently dried. Pollution was measured before testing to verify it was within the target range. For the actual test, the dried, polluted insulators were placed in a vertical position within the test hall.
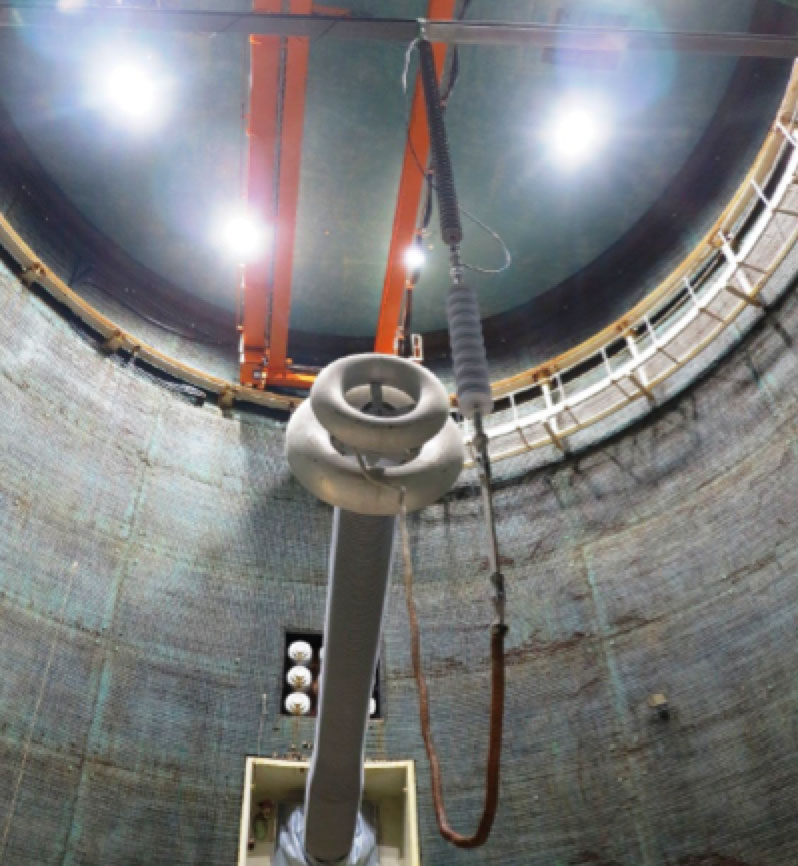
Two different pollution values where used for testing to achieve pollution performance curves. Target pollution values were 0.03 and 0.12 mg/cm². The test was performed by wetting insulators with steam fog in the climate hall and then applying negative DC voltage, according to IEC 61245. Results of these tests yielded pollution performance curves for the insulators. These curves were then implemented in the Insulator Selection Tool (IST) Program that can calculate mean time between failure for the insulators. Results show that the MTBF is greater than 600 years for both insulators.
Full Scale Pollution Test
For the full scale pollution test, insulators of both design 1 and 2 were suspended in the climate hall in a V-position with 90° angle, i.e. the same as for actual installation on the DC tower. The insulators where polluted the same way as was the case for the short insulator used in the rapid flashover tests. SDD pollution level was set to 0.069 mg/cm². Actual pollution level used during testing was 0.069 x 1.4, where 1.4 is a correction factor to account for multiple insulators in parallel, resulting in an SDD level of 0.1 mg/cm². Voltage for this test was maintained at nominal voltage for the line of -525 kV DC. During testing, steam fog was injected into the climate hall and leakage current measured for each insulator. Acceptance criteria was that no flashover should occur for three consecutive tests over a duration of 100 minutes. If a flashover occurred during for one of these tests, a fourth test had to be conducted with no flashover. Leakage current offered a good measure of insulator pollution performance and was also an indicator when fog had washed the pollution layer from the insulator. Table 4 shows results of these pollution tests.
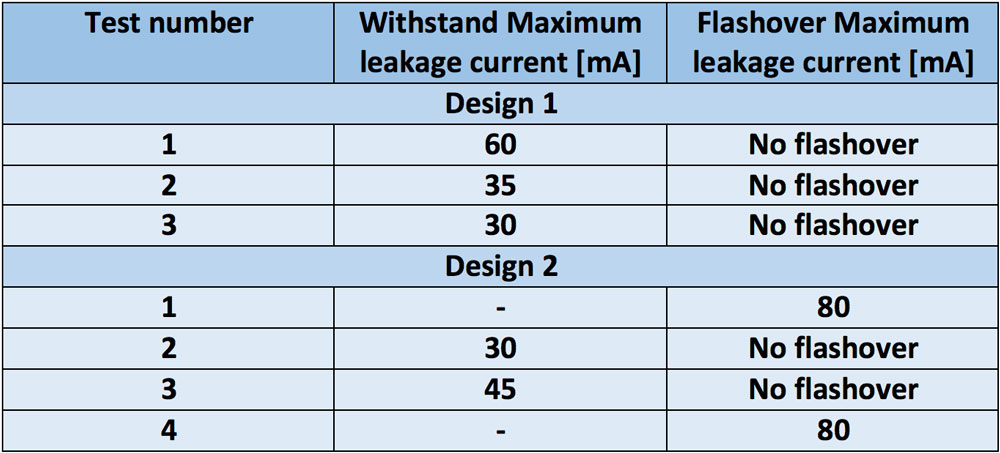
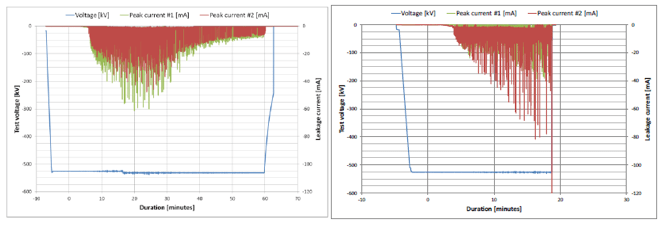
Based on results of the full scale pollution performance test, insulator Design 1 passed. The Design 2 insulator, however, did not pass since it flashed over on both the first and fourth pollution tests. Design 1 was therefore chosen for the project and additional further testing for ice accretion.
Ice Accretion Testing
Based on results of the pollution tests, the longer insulator of 6180 mm (i.e. Design 1) was chosen for the line and ice accretion tests were performed on the V-string installation. This was carried out in order to further validate design and assess performance of the insulator during ice loading. Ice parameters were the following:
• Glaze type of ice (transparent ice with density 0.7 to 0.9 g/cm³);
• Water conductivity of 100 µS/cm;
• 23 mm ice thickness at the standard rotating cylinder. This corresponded to an ice load of 12 kg/m.
Ice accretion was done without voltage and negative polarity used for the tests. Simulation of ‘sun-rise’ was used instead of the ‘freezing rain’ method so as to best simulate when water freezes along the insulator at night and melts slowly after sunrise. Pass criteria for the test was that no flashover should occur after three voltage tests.
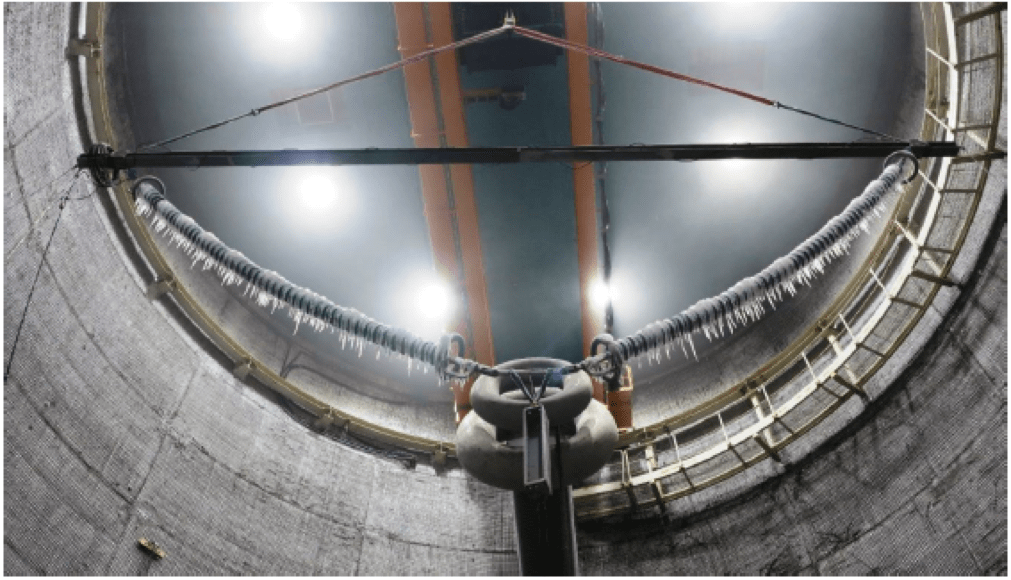
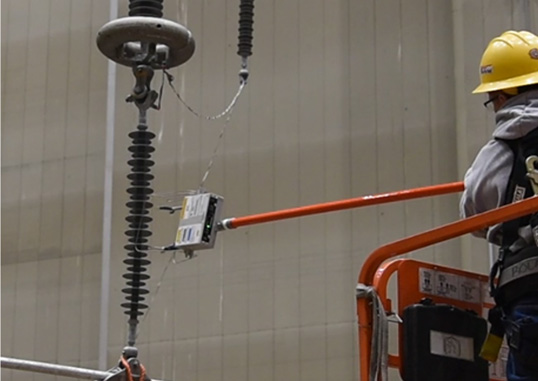
Insulators were suspended in the correct V-shape configuration and water sprayed onto them in a climate hall with controlled temperature. Water was sprayed on until the insulators had the target ice thickness, controlled by measuring the ice on a standard rotating cylinder. A resistive shunt was installed at the top end of each insulator to measure leakage current. After the ice build-up, temperature in the climate hall was increased to start melting. A voltage of 525 kV DC was applied and maintained during the entire melting process and rise in leakage current measured. The test ended when the leakage current had passed its peak level or there was no ice left on the insulator. In total, three tests were performed with no flashover of the insulators. The conductivity and ice thickness of these tests are shown in Table 5.

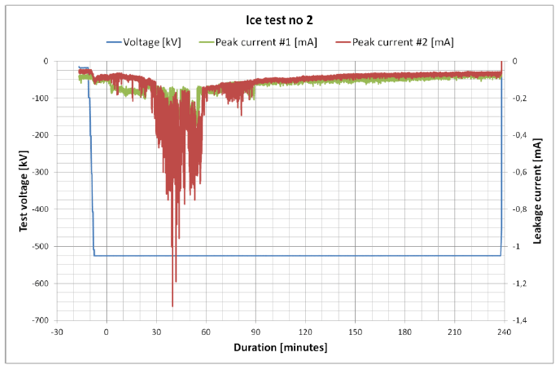
Highest leakage current was measured during the second test but was still below 2 mA. Data for applied voltage and leakage current over the insulators for test #2 is provided in Fig. 4. Only results for test #2 are shown here since this test had the highest increase in leakage current.
Installation & Handling of Insulators
One of the greatest risks when applying composite insulators is mishandling on site by the contractor. Composite insulators are in fact highly fragile and can easily be damaged if handled incorrectly. In this case, the new DC line was the first within the Statnett grid to be equipped with composite insulators along the entire line. Normally these have been used mainly as support insulators in jumper loops. Correct handling of the insulators was therefore important for this project, especially due to the length of the insulators and how exposed they might be to damage from mishandling during transport or installation. Statnett therefore held a seminar for the stringing and installation team that worked with these insulators. Since the majority of the stringing team had limited language skills in Norwegian and English, the seminar was based only on pictures and illustrations displaying proper and improper handling of insulators. There was also an interpreter present to provide immediate translation, and facilitate in answering questions. At the end, Statnett received positive feedback from the workers. Moreover, some of the information provided came as a surprise to them e.g., how vulnerable insulators were to damage due to thinness of the silicone rubber housing. The Handling Guide for composite insulators presented to the contractor was developed during a project in collaboration with TSOs from neighboring countries.
Insulator Protection During Installation
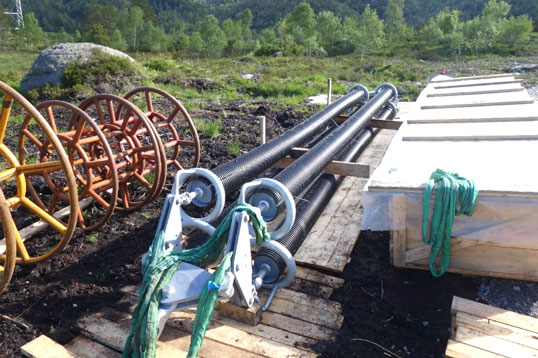
All tower erection as well as installaiton of insulators and fittings was done by helicopter since no cranes could be used in Norway’s rough terrain. Therefore, string fittings were pre-assembled with the insulators at a location close to towers and then helicopters would fly them out. But this posed a possible problem for the insulators due to their length and how easily they can bend. According to the manufacturer, bending on the glass fiber core rod must not exceed 20° and therefore special attention had to be taken when insulators were lifted off the ground by helicopter. Installation of tension strings proved particularly critical due to the installation method for them. Tension fittings were installed on towers, together with the composite insulators, in a vertical position. The string was then raised by winch system to a horizontal position. But this process risked bending the insulator more than the allowed maximum of 20° due to the weight of end fittings. The problem was finally resolved by introducing a supporting plastic sheath to surround the insulators prior to installation.
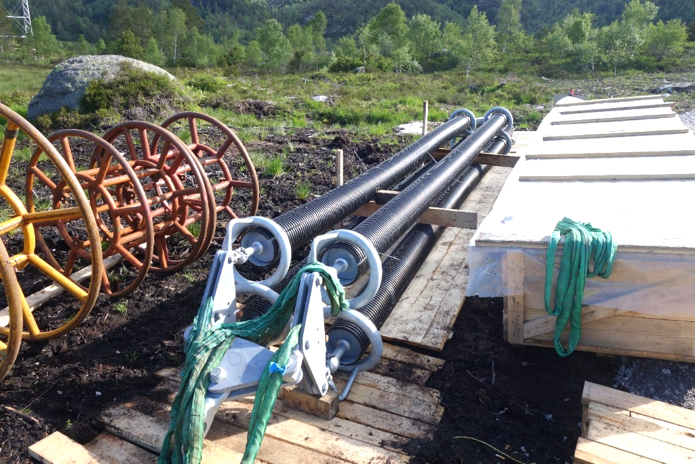
Green straps at the ends of strings are fastened to a helicopter for transport to the tower site while installation crews on towers await the tension string and fasten the double eye to the tower. After installation by helicopter, strings are slowly raised to a horizontal position using a winch placed on the ground. Wire from the winch is then fastened to the end of the string and used to raise it. During this process, insulators experience minimum bending due to the plastic sheaths.
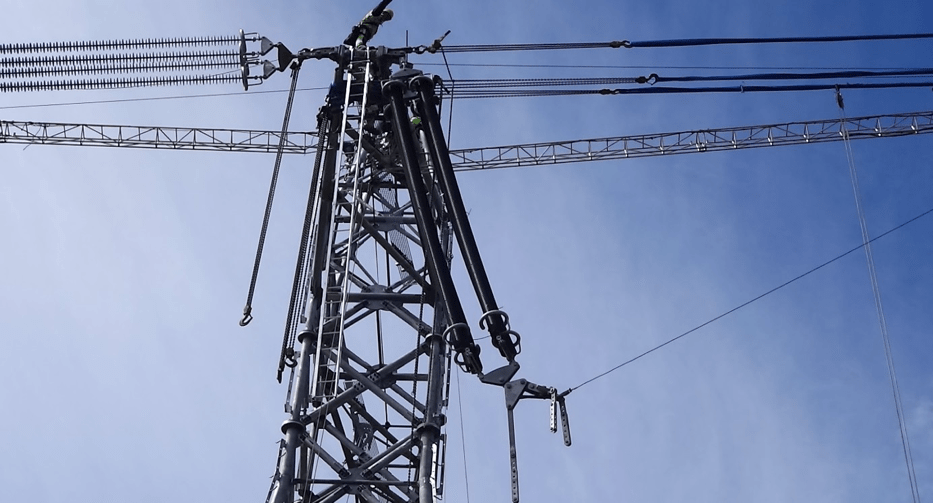
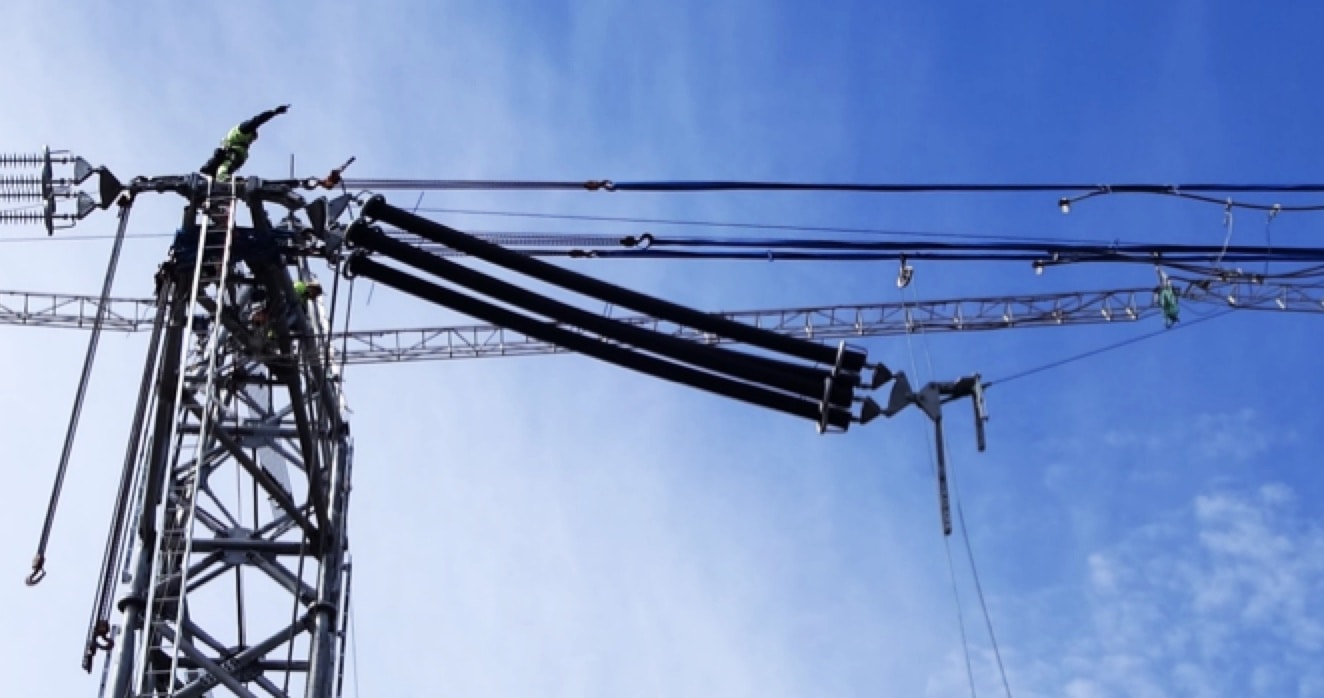
The plastic sheaths remain on the insulators while the installation crew fastens the conductor to the string with implosive fittings and tensions the conductors to their required height. This is done to protect insulators from damage when the workers are moving between the tower and the line. When all installation work has been completed, the plastic sheaths are removed. To further protect them, a stepping platform is installed below and a little to the side of insulators strings. With the platform in this position, workers do not need to work directly below the insulators. As such, contact with insulators is minimal after sheaths have been removed. Once construction of the line has been complete, Statnett planned to inspect all insulators for hidden damage using a corona camera. Such inspection is expected to be routinely carried out for the full service life of the line.

