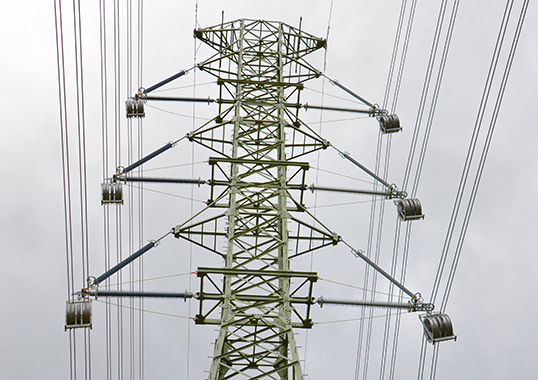
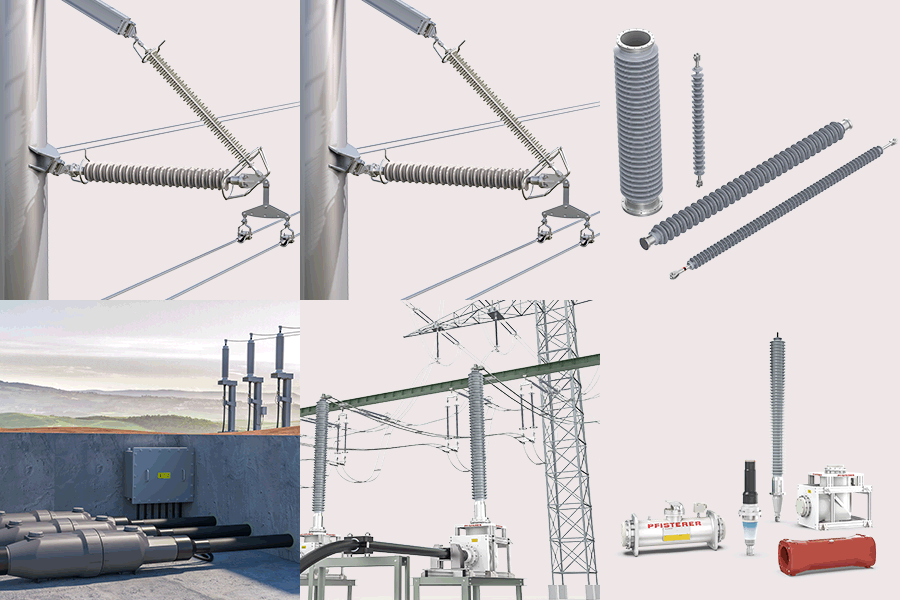
Use of composite insulators has increased rapidly. Historically, the main driver was excellent performance in polluted areas. But a more recent application has been in clean environments, where composite insulators provide possibilities to design more aesthetic tower designs, which are often also compact. Handling advantages are used in such applications as well. However, compared to ceramic cap & pin strings, composite insulators do not have several metallic caps along the string that serve to grade electric field. Water induced corona on a polymeric material’s surface can deteriorate hydrophobicity and cause even worse damage if the corona activity is continuous. Thus, it is necessary to define, verify and standardize limits for permissible electric field along composite insulators. Also, to assure reliable service performance of insulation structures equipped with composite insulators in polluted/icing environments, both pollution and icing performance must be verified. Yet there are still no IEC standards for these important parameters. Ageing simulated by tracking and erosion tests must also be verified.
This recent past contribution to INMR by Igor Gutman and Andreas Dernfalk summarized start-of-the-art results of recent investigations of corona, pollution, ice/snow and ageing tests for mostly composite insulators and some ceramic insulators.
Techniques to Verify Water Drop Corona
The two most important criteria for limiting electric field to levels that eliminate permanent corona from metal parts and along the surface of composite insulators were presented in an IEEE paper:
1. At all metal parts (such as yoke, end fitting, grading ring, arcing horn, etc.), maximum E-field shall be limited to 1.8 kV/mm;
2. At the sheath of the insulator housing, maximum E-field shall be limited to 0.42 kV/mm (maximum average along 10 mm). This criterion mirrors the ‘water drop corona’ phenomenon.
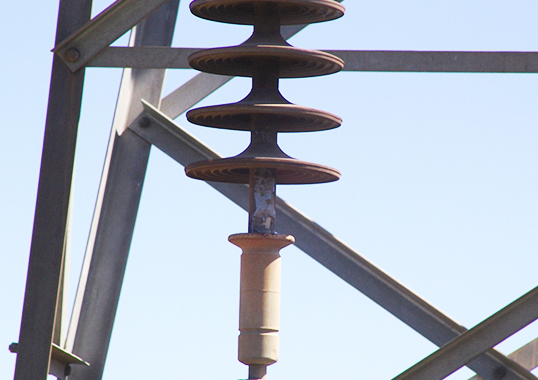
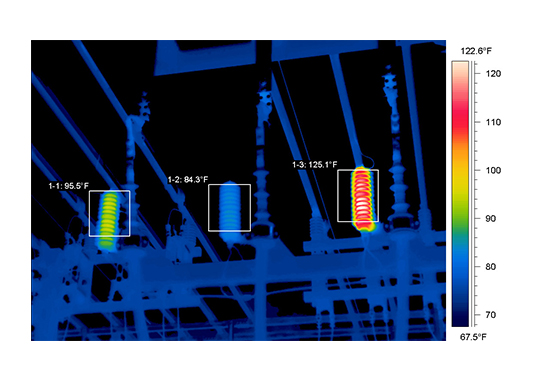
The criterion proposed for water drop corona has been verified by observations in service. For example, calculations for one of the insulators in service showed that electric field significantly exceeded (by about a factor of two) the criterion 0.42 kV/mm, as shown in 1 (left). This should theoretically lead to intensive corona at operating voltage under humid service conditions. This prediction was confirmed by UV inspection (Fig. 1, middle). Later, close inspection revealed deterioration due to corona activity on the housing of the first shed close to the HV end. Corona activity was so intense that a crack in the sealing could be seen.

While fulfilment of the first criterion (from the metal parts) can be verified by a standard RIV test described in IEC, the second criterion is still not verified by any standard test. A proposal for such test has been made and the procedure verified on several insulator designs, both single insulators and insulation structures. Further investigations are in process.
[
Results of Round Robin Testing
Stages in development of the Water Drop Corona Induced (WDIC) test have confirmed that this test is representative, repeatable and cost-effective. This test verified critical levels of electric field that lead to water drop corona, as predicted by calculations. Thus, this test method complied with the three of four standard IEC requirements for any new test and it was decided to check reproducibility by the Round Robin Test, RRT (same set-up, test method and test objects) at five different laboratories around the world (i.e. in the Czech Republic, France, Germany, Japan and Sweden). The strict RRT procedure was based on the same test description.
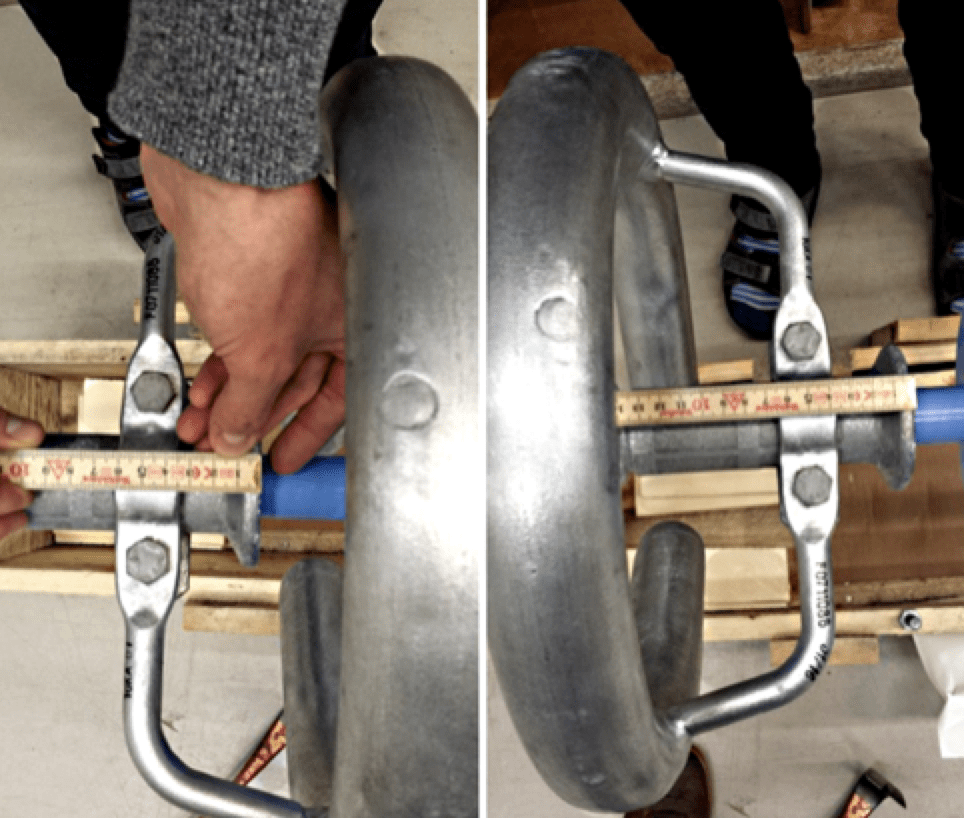
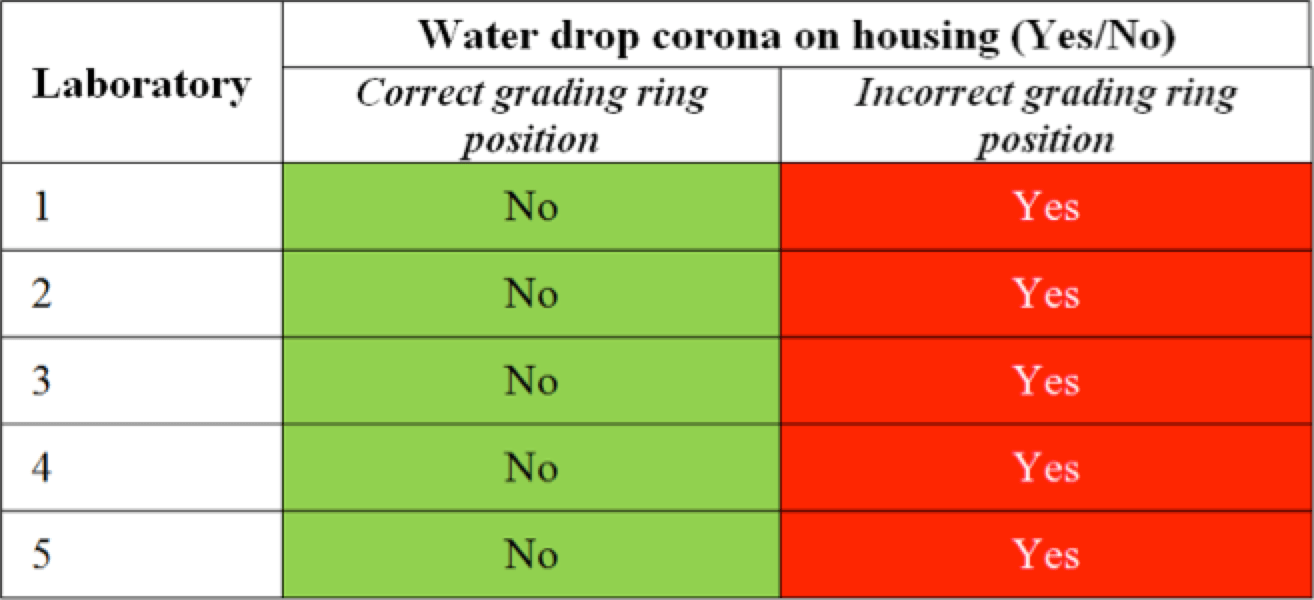
Two test set-ups were decided for verification. The first was intended to verify that the insulator is correctly graded with respect to electric field and that, as such, no water induced corona should occur. The second set-up should intentionally trigger water induced corona, obtained by placing grading rings in incorrect position upside down. Such incorrect placement has in fact sometimes been observed in service. Two positions of grading rings (correct/incorrect) were first evaluated by 3D-electric field calculations. For the correct position, electric field was 0.32 kV/mm (< 0.42 kV/mm); for the incorrect position the electric field was 0.85 kV/mm (> 0.42 kV/mm). Thus, appearance of corona was predicted for the incorrect position. Identical pass/not pass results were obtained by all laboratories, i.e. the insulator passed the test for the first test set-up (correct positioning of grading ring) and failed for the second set-up (incorrect positioning of grading ring). Test results are summarized in Table 1. Intensity of the corona observed differed slightly differed at different laboratories, most probably due to differences in ambient conditions or because metal parts may not have been properly dried before testing. However, final results, i.e. observation or absence of corona, were identical at all laboratories.
Comparison of electric field calculations and their verification by Water Drop Induced Corona testing performed both during Round Robin Testing and earlier concluded that the test method is reproducible, representative, repeatable and cost-effective. Therefore, it fulfils all these formal IEC requirements for a test procedure and is being recommended to CIGRE/IEC for implementation in relevant normative documents. As a first step toward international acceptance, proposed electric field limits and method of verification were presented to CIGRE Working Group B2.57 that is developing Guidelines for application of line composite insulators.
Test Techniques to Evaluate Pollution Performance of Structures Based on Composite Insulators
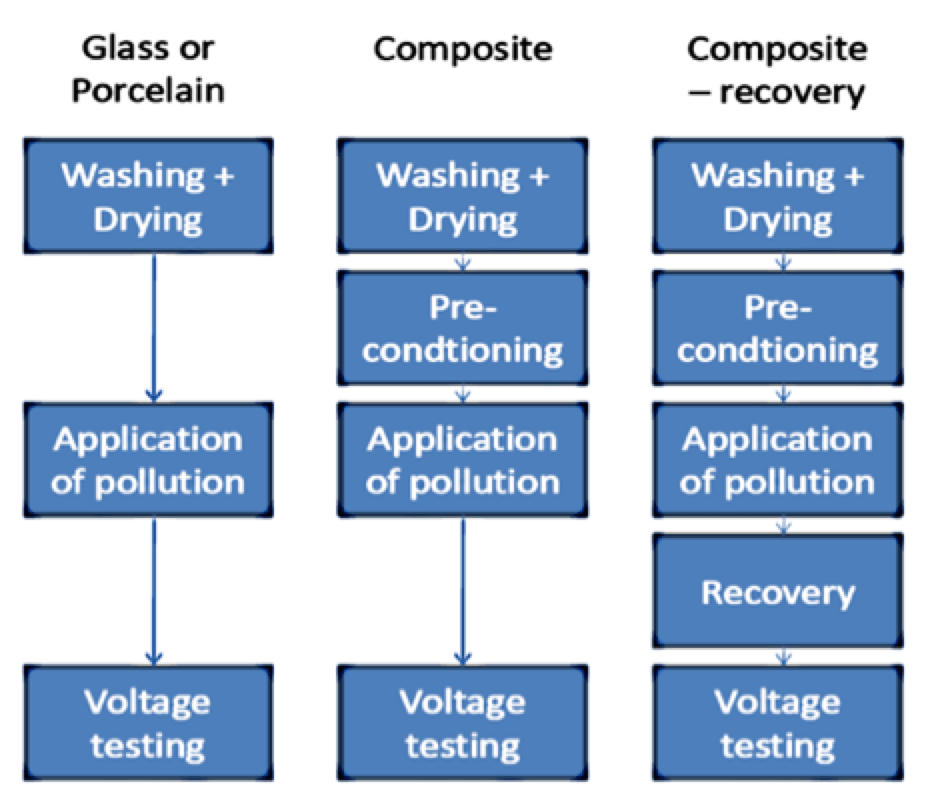
There is no IEC test method for pollution testing of composite insulators. The only two IEC standards available for AC and DC pollution testing respectively are valid for porcelain and glass insulators and were only slightly updated in recent versions issued in 2013-2015. At present, the only reference available for pollution testing of composite insulators (AC voltage only) is a CIGRE Technical Brochure that proposes the test be performed according to Fig. 2. The basic test procedure is adopted from IEC 60507, however a new procedure for pre-conditioning is included. Moreover, the test can be performed with or without simulation of hydrophobicity recovery of composite insulators; this depends on the environment where the insulators are intended to operate. A CIGRE Technical Brochure describing the rapid flashover pollution test methods for both natural and artificial pollution and for both ceramic and composite insulators will be issued this or the next year. Given lack of standards, tests of different types of composite insulators, especially in geometrically complex structures and sometimes full-scale and three-phase, require special techniques.
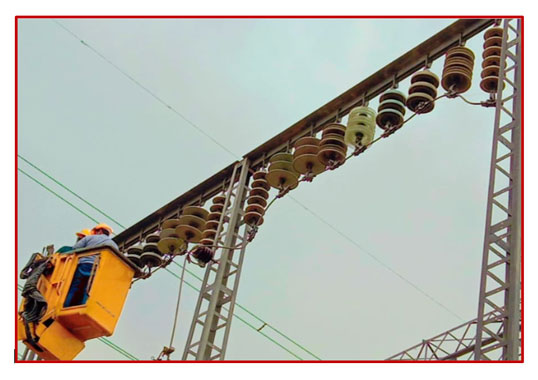
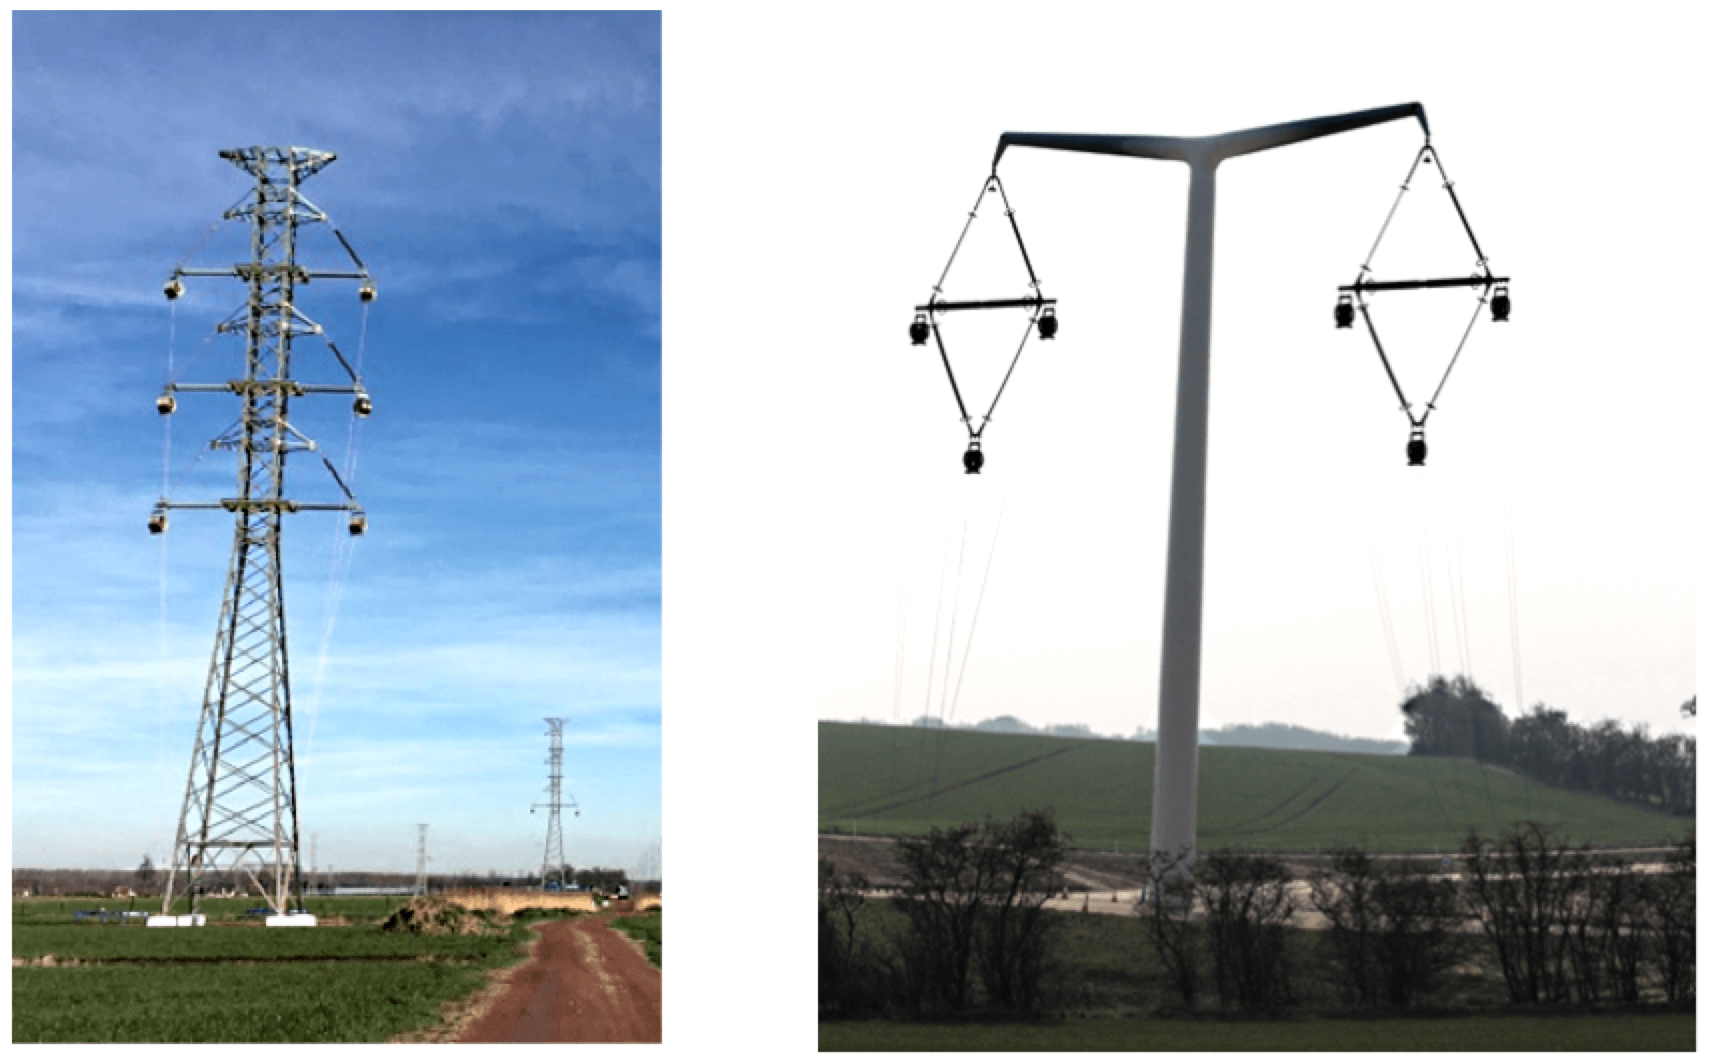
The proposed test method was successfully used in a number of practical projects related to composite insulators – with and without simulation of hydrophobicity recovery. For example, three geometrically complex structures were recently tested. For the diamond-shaped structure used for the T-Pylon in the U.K., (middle photo) the test was performed as a three-phase voltage withstand test using three independent transformers, making it quite unique.
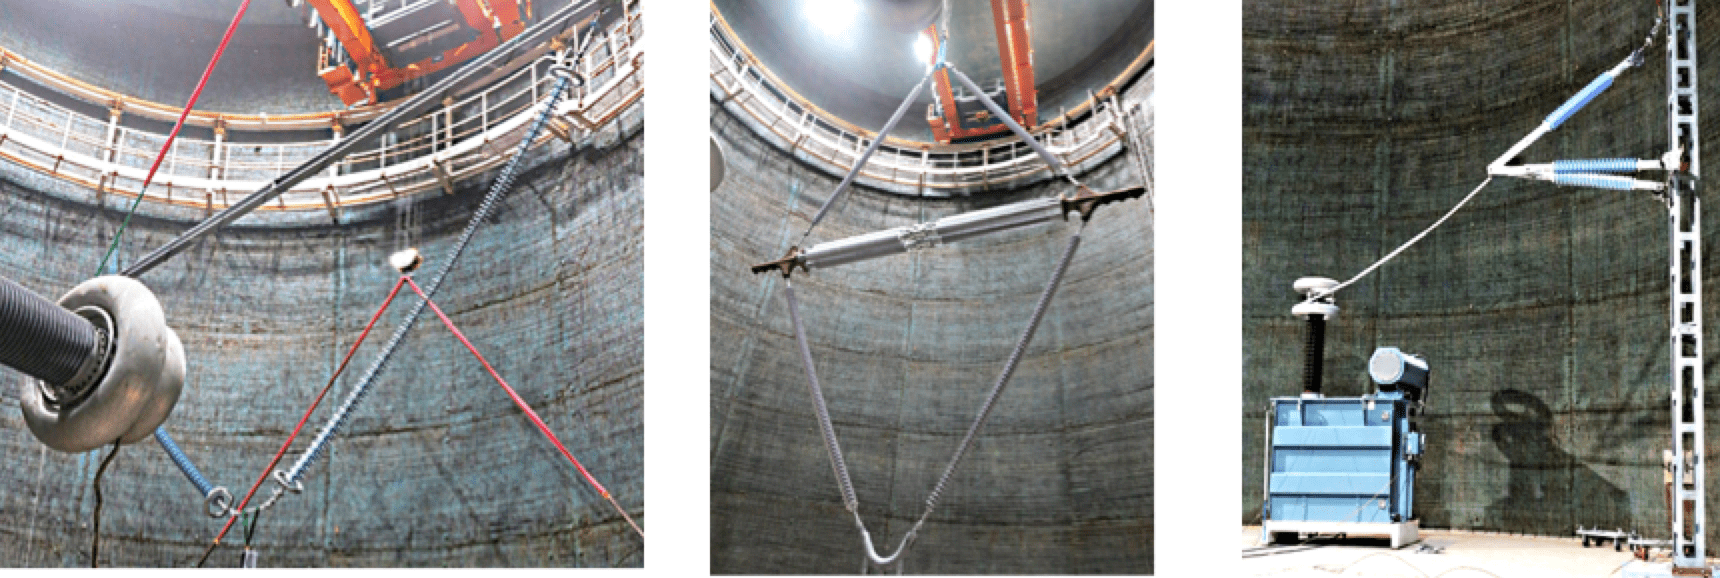
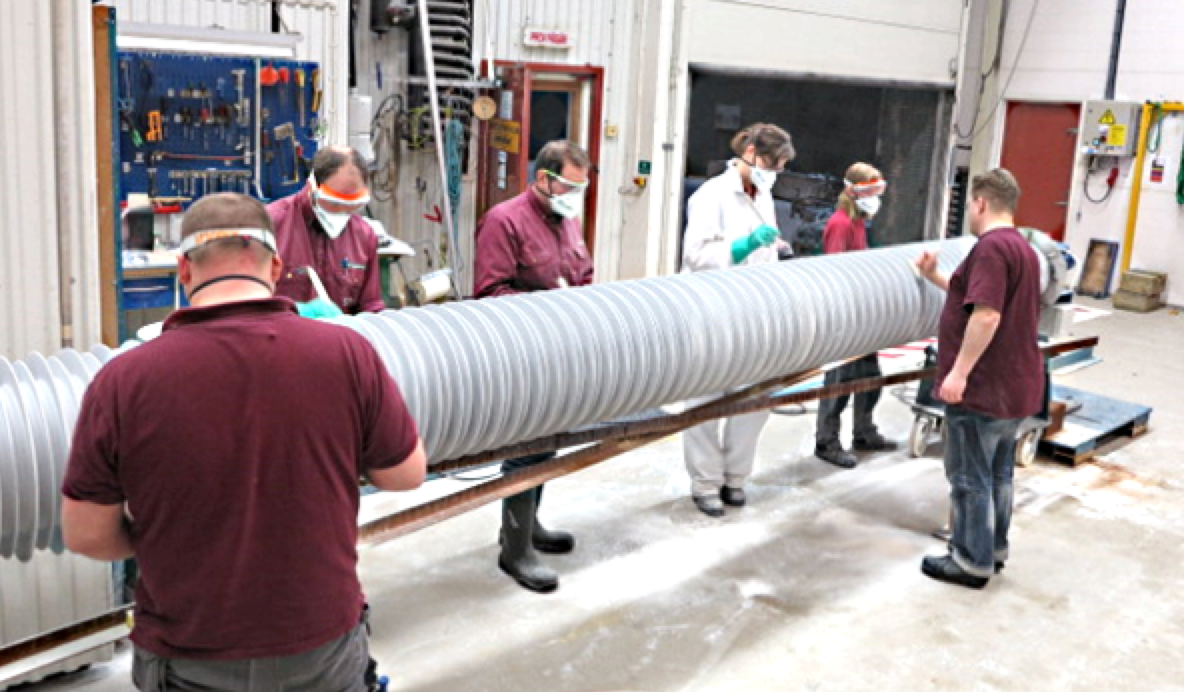
For each test, the pollution layer specified was applied separately to all insulator units before they were assembled in the test hall. This was a rather new technique because earlier only single insulators were tested using the CIGRE test method. After recovery time in a dry room (if necessary), the complete insulation structure was mounted and subjected to voltage tests while wetted by steam fog of standard intensity according to IEC. It is virtually impossible to obtain a uniform stable pollution layer on insulators having a silicone rubber surface using standard IEC procedures for contamination in the solid layer test (i.e. by spraying or dipping). The result is usually an unacceptably large spread in flashover results. Thus, the test procedure comprises:
• Gentle cleaning;
• Pre-conditioning by dry kaolin powder;
• Application of pollution layer by spraying.
The same process is feasible for rather large insulators, but requires more manpower.
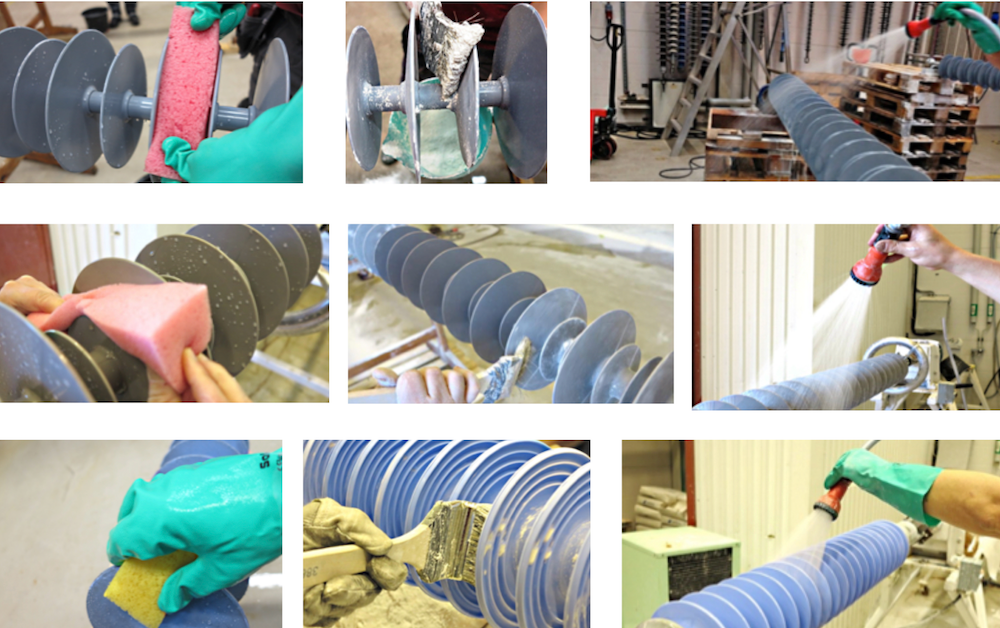
Before application of contamination, the insulators were cleaned by washing with warm water and a sponge. Pre-conditioning was performed by applying a dry inert material in powder form (in this case kaolin) to the clean and dry insulator surface using a brush. This layer was applied as uniformly as possible, controlled visually. After application, most of the kaolin powder was blown off by compressed air until only a thin layer remained on the insulator surface. Adequacy of this layer was controlled visually and by Hydrophobicity Class (HC) measurements performed according to IEC TS 62073 Method C. This was to ensure that the surface of the insulator was completely hydrophilic (HC=7) after pre-treatment. Pre-conditioning masked the hydrophobicity of the composite insulators sufficiently so they could be sprayed (IEC standard method) by the slurry to apply the uniform pollution layer. During application and through the period of drying, the insulator was being rotated at about 10 rpm. The slurry was comprised of a mixture of tap water, kaolin and salt (NaCl). The amount of salt was chosen to achieve the main pollution parameter, i.e. target Salt Deposit Density (SDD). 40 g of kaolin per litre of water was used, as prescribed by IEC 60507 for standard pollution testing of ceramic insulators. The rotating insulators were kept at room temperature when spraying on the slurry.
The proposed procedure provided very high correspondence with target contamination levels (typical technically acceptable level is ±15-20%) and repeatability of the results; this is illustrated in Table 2.
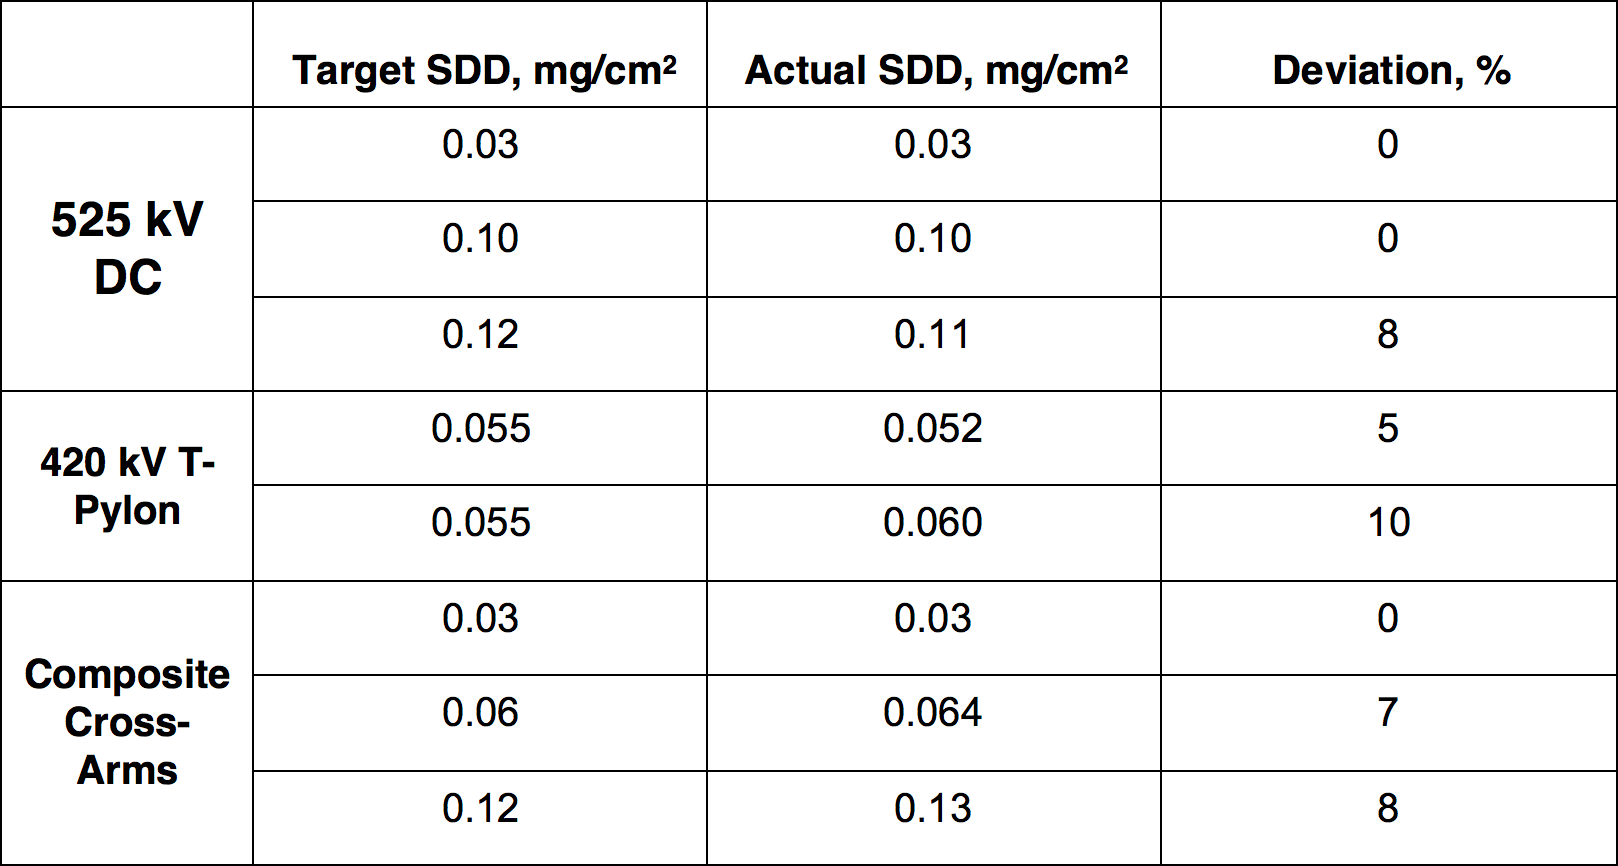
The new pollution test method based on recommendations of the CIGRE Technical Brochure has been successfully and practically applied for both single composite insulators tests and even geometrically complex insulation structures for 420 kV AC and 525 kV DC. This method provides stable and repeatable pollution parameters and can be used without or with simulation of partial recovery of hydrophobicity. It is thus proposed that CIGRE/IEC consider this new piece of data while discussing further standardization of the pollution test method for composite insulators.
New Test Techniques for Evaluating Icing/Snow Performance
The only normative document available at present for ice and snow testing of insulators is the applicable IEEE Standard. But this standard can be treated more as guidelines than a standard, which typically contains principles for the test methods and procedures to evaluate electrical performance of insulators under freezing conditions. Since this document is more or less a compilation of different techniques for ice testing, it is rather complicated to follow these guidelines. The industrial practice is therefore to use the ‘principles’ provided but adapted to practical cases. In regard to snow testing, the standard proposes using only natural snow. Below is a summary of practical cases of using the principles of this standard for ice testing, together with an example of creating artificial snow.
Full-scale ice tests were performed for two of the insulation structures presented above. For the composite V-string, this was preformed as a full-scale DC test while for the diamond structure it was performed as full-scale three-phase AC test. The test procedure basically complied with the IEEE Standard. However, it was decided in both cases to make the test more conservative, providing for a theoretically lower flashover voltage:
• Use of the ‘sunrise’ test method instead of the ‘freezing rain’ test method. In this case, the test simulates night freezing of ice under negative temperatures with slow melting after sunrise. Because salt in the ice is frozen closer to the surface, dripping water conductivity for the ‘sunrise’ test will be higher than for the ‘freezing rain’ test – even if the same applied water is used.
• Performing ice accretion under de-energized condition. In this case, based on experience at STRI, the ice will not be melted by leakage current activity and might be thicker and with longer icicles for the same accretion time than during ice accretion under voltage.
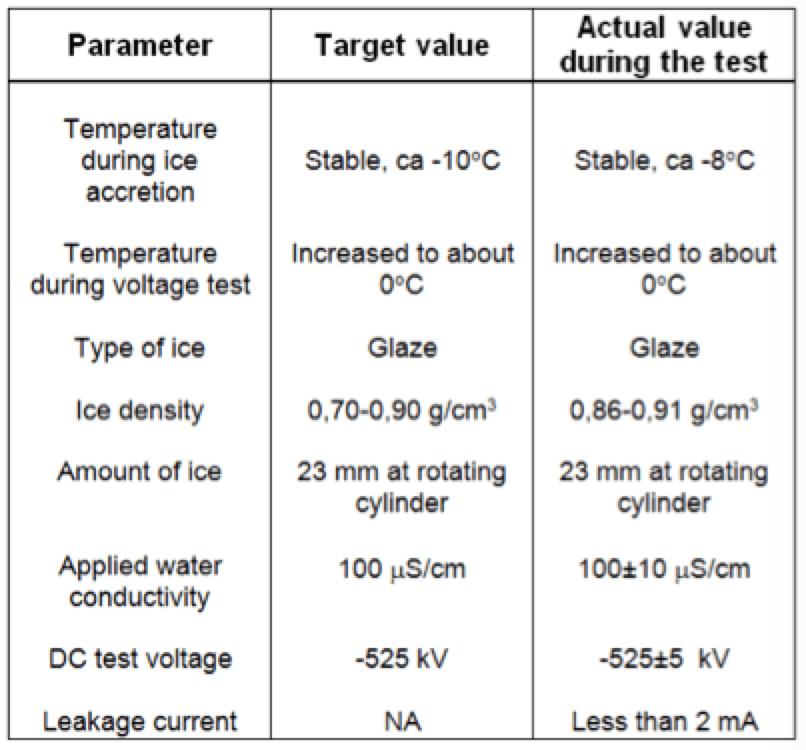
The main challenge was to create ice accretion on geometrically complex insulation structures. Two innovative methods were developed and implemented. The first was a sophisticated structure of aluminum beams, mirroring the actual insulation structure, mounted on the wall of the climate chamber. The structure carried a number of arrays of fixed spray nozzles fitted with special heaters for temperature control and de-frosting. This was used for ice accretion. A second innovative method was needed to obtain the increase in temperature to simulate the sunrise service case. This was achieved by letting clean fog (steam) into the test hall with an additional flow of warm air from outside through a small door, while fans on the roof were slowly evacuating air, thereby creating a slight draft. The gradient of temperature increase in the proximity to 0°C was about 1°C/h. Glaze type ice (i.e. clear and transparent) was accreted using water spraying from a distance of about 1 m. During ice application, air temperature in the test hall was kept around -8°C. Target ice thickness was specified for the standard rotating cylinder. During the first ice accretion, the time needed to achieve required thickness was defined. For the second and the third ice accretions, both the standard rotating cylinder and estimated time were used to define duration of the ice accretion phase. Prior to start of each voltage test, small samples of ice were removed from the insulators. Volume and weight were measured using cold oil in a measuring cylinder and with a scale. Some samples were then thawed and conductivity was measured when the thawed water had reached room temperature. It is considered that the ice accretion well simulated the service case, i.e. icicles grew downward, without bridging shed spacing of inclined and horizontal insulators.
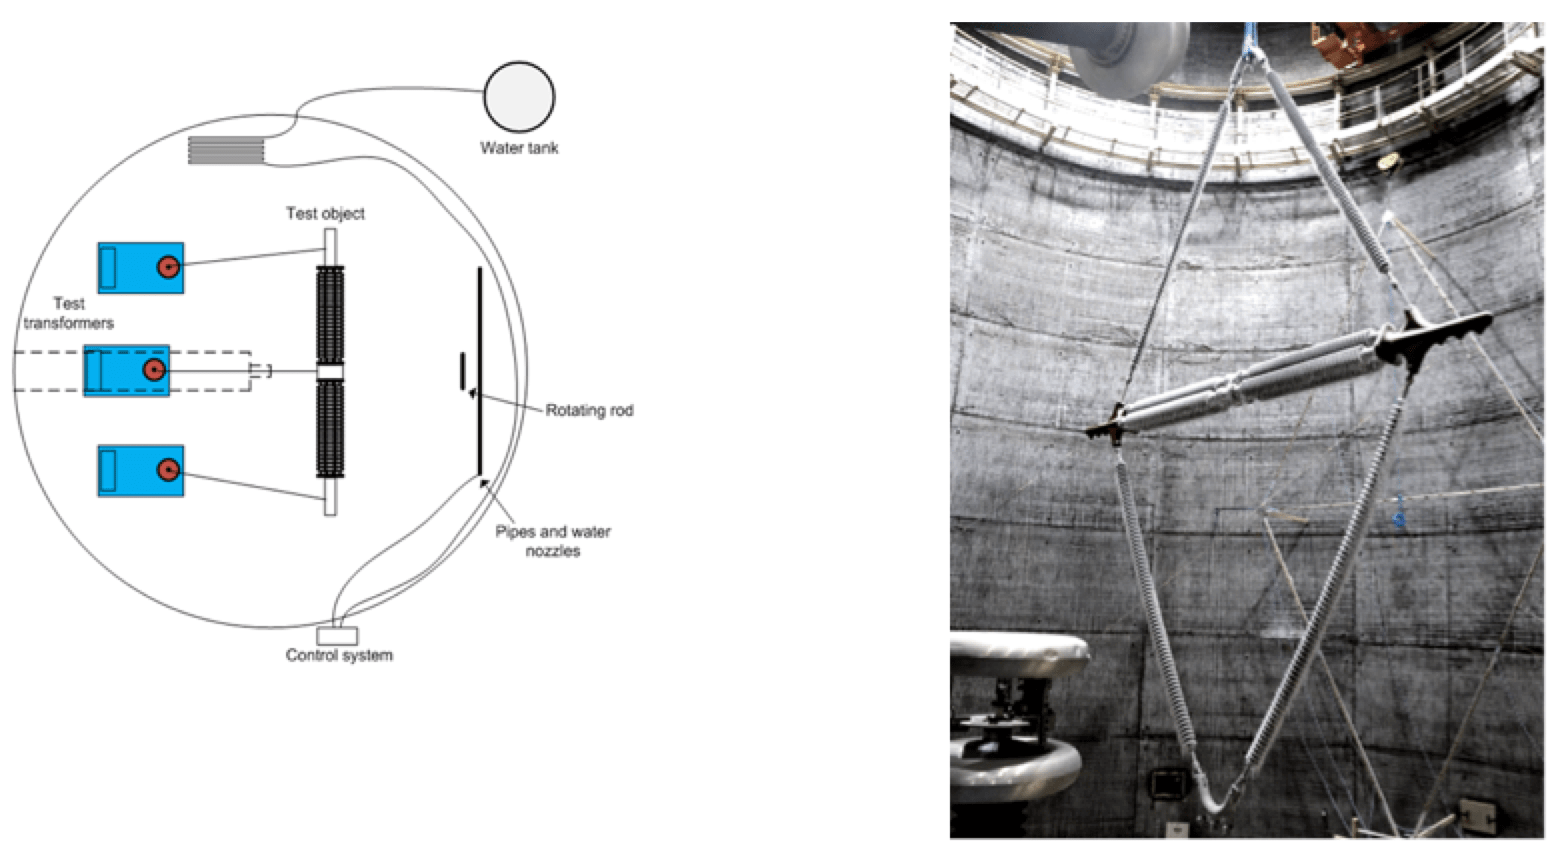

The proposed test procedure provided a high level of correspondence with target contamination levels and repeatability of results, as illustrated in Table 3. Both these tests were used for practical verification of full-scale different insulator options for the specific conditions in the U.K. and Norway.
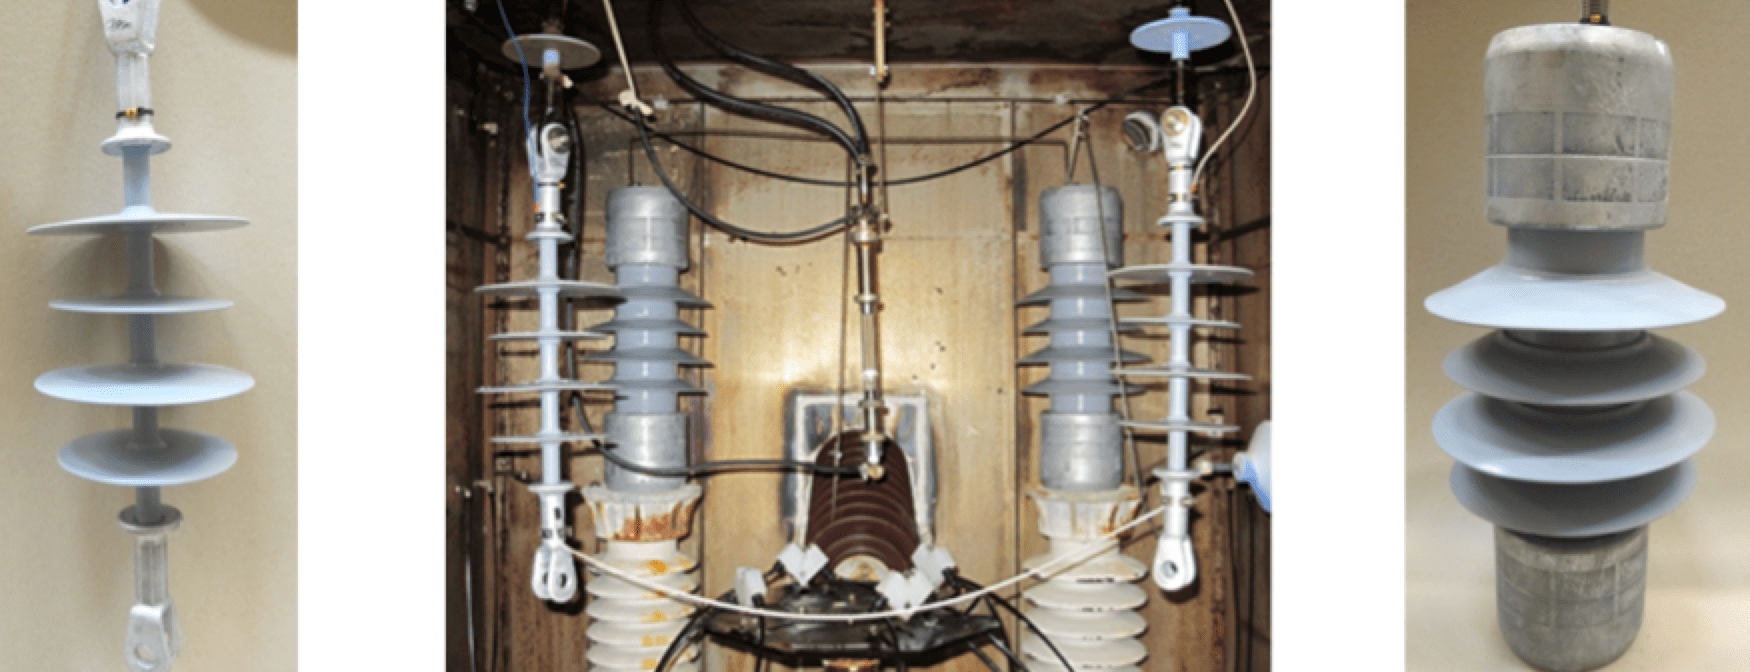
Regarding snow testing, it was confirmed by a series of tests that it is feasible to create artificial snow with such pre-defined parameters as visual appearance, density, conductivity and liquid water content. Snow for voltage tests was produced artificially in the climate test hall. Appearance of the snow-accreted insulator was similar to what was seen in service (i.e. photo shows naturally snow accreted insulators and cleaned one in parallel to it). Highly specific test parameters, originating from field measurements, were reproduced. The innovative test method for artificial snow accretion was used for comparative flashover testing of insulators of different types for the specific service conditions in Japan.


Icing and snow tests presented here are of practical need and can be used for outdoor insulation selection and verification in actual projects and in different environments (Norway, U.K. and Japan). It is therefore proposed that CIGRE/IEC consider creating some normative document for standardization of such tests covering ceramic as well as composite insulators and artificial ice and snow.
[
Test Techniques for Evaluating Tracking & Erosion
At the design stage all composite insulators, including station post and hollow core insulators with large diameters, need to be verified by tracking and erosion tests. Presently, the main choice is between a 1000h salt fog test (IEC 62217) or the 5000h test under multiple stresses (IEC/TR 62730). According to the IEC/TR 62730, a number of companies experienced high levels of deterioration and damage as well as flashovers when testing composite insulators with larger diameters. To investigate this, below presents and analyzes more detailed and ‘academic’ results from standard and non-standard multiple stresses tests. The following three 5000 hour tests were performed:
• Test 1: Two samples of the ‘thickest’ insulators and two samples of the ‘thinnest’ insulators were tested using the standard IEC procedure, i.e. at 20 mm/kV and using direct spray with IEC 60507 nozzles.
• Test 2: The same test samples were tested at the same voltage stress, i.e. 20 mm/kV, but using indirect spray with IEC 60507 nozzles directed away from test objects.
• Test 3: Slightly different samples of the ‘thickest’ and ‘thinnest’ insulators were tested at higher voltage stress, i.e. 15 mm/kV and with indirect spray.
Leakage current measurements and visual (hydrophobicity) inspections every 1000 hours complemented the standard test procedure.
Comparison of results of three individual 5000h tests are presented separately in Table 4 for insulators with larger (D) and smaller (d) diameters. Results are compared based on severity of deterioration, level of leakage current, number of flashovers and level of hydrophobicity after testing. These parameters were averaged for all test samples. The test outcome considered to represent service conditions is marked by GREEN. Results are:
• For the standard procedure Test 1 (20 mm/kV and direct spraying), the level of current is too high for both insulators with different diameters. This makes the test of more of ‘pollution’ character than ‘ageing’. Also, level of deterioration for insulators with larger diameter is too severe compared to actual service observations.
• For the non-standard procedure Test 3 (15 mm/kV and indirect spraying), level of current is also too high, especially for insulators with smaller diameter. Also, three flashovers were registered on insulators with smaller diameters, indicating again that such test is more ‘pollution’ than ‘ageing’.
• For the non-standard procedure Test 2 (20 mm/kV and indirect spraying), level of current is acceptable as well as level of erosion when compared to real service experience. Also, no flashovers were recorded and the level of hydrophobicity at the end of the test is intermediate, similar to real service observations.
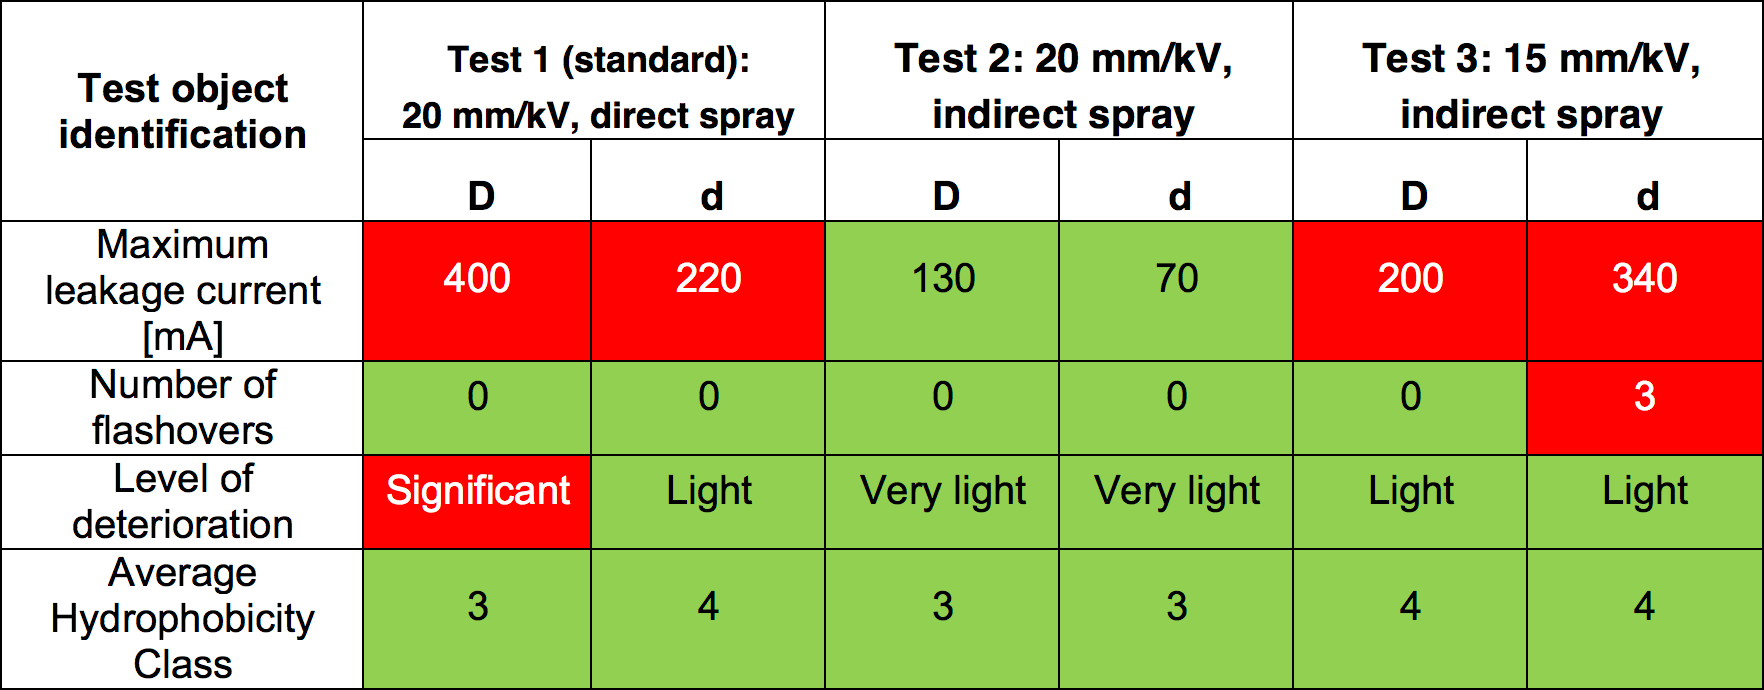
Results of three series of 5000h comparative tracking and erosion tests using the present standard procedure (IEC/TR 62730, direct spraying) and the non-standard test method based on indirect spraying revealed: heavy erosion not seen in service can be observed in the standard test, especially on insulators with larger diameters. This can be explained by uneven distribution of fog due to direct spraying. High-level currents in this test are also not typical for an ageing type of test, converting it more to a pollution test mode. These results were confirmed by observations during other similar tests. It is thus proposed CIGRE/IEC consider application of the method with indirect spraying.
Summary
Composite insulators are an attractive option for new insulation structures that, in some cases, make public acceptance of overhead lines easier. At the same time, to assure reliability of application of composite insulators in more geometrically complex structures, they must pass relevant tests. But at present there is a lack of such tests within CIGRE/IEC. This work presented a summary of innovative test methodologies covering corona, pollution, ice, snow and ageing issues. For each of these parameters, relevant tests that mirror service conditions and environments were developed and practically applied, e.g.:
• Reduced-scale and full-scale pollution tests on insulators and insulation structures up to 420 kV AC and 525 kV DC;
• Single-phase and three-phase pollution and ice tests on complex insulation structures;
• Pollution tests on composite insulators, with and without simulation of recovery of hydrophobicity.
For most of these tests, results were used for practical dimensioning or for verification of the dimensioning of practical insulation options.

