While overhead lines are among the most cost-efficient solutions, they have much greater sensitivity to environmental stresses such as pollution, wind, snowfall and thunderstorms. This edited past contribution to INMR by Michele de Nigris of Ricerca sul Sistema Energetico (RSE) in Italy reviewed recent research focused on two major threats: surface pollution on line insulators and build-up of wet snow sleeves on conductors.
The first part is dedicated to line insulators and use of coatings to limit effects of pollution on their surface. To assess the threat linked to surface contamination, an update is given on mapping pollution severity and on the development and use of innovative pollution monitoring devices. Two approaches to RTV silicone coatings are addressed: partial coating of glass insulators to enhance pollution performance through hydrophobic properties that inhibit formation of a continuous wet pollution layer; and super-hydrophilic coatings and treatments to facilitate permanent natural surface washing, thus impeding pollution build-up. Given that these two techniques are at much different levels of maturity, the focus of research has been on both long-term performance of RTV coating formulations and application techniques.
The second part is devoted to behaviour of line conductors and ground wire under wet snow conditions. Different solutions for snow sleeve mitigation are addressed through identification of influencing parameters as well as results of tests conducted both in the laboratory and in the field.
Monitoring & Assessing Contamination
High levels of contaminants on insulator surfaces, whether salt deposits near seacoasts or industrial and agricultural pollutants, can trigger surface discharges of line and station insulators with resulting threat of service interruptions. In Italy, for example, severe pollution conditions are detected in several regions and these are only made worse by windstorms and high levels of humidity. Unfortunately, such phenomena are now occurring with increasing frequency and intensity due to on-going climate change. If anything, the situation is only expected to worsen in coming years.
Insulation surface contamination is site specific since it is linked with local pollution sources, variable weather (e.g. precipitation, duration of dry periods, wind direction and intensity, etc.) and time (especially given the long service life of transmission assets). Pollution considerations therefore impact long-term electrical system strategies, overhead line design, maintenance planning, daily operation and, eventually, emergency and resilience management. To address these aspects, a series of projects and tools have been set up in Italy, in collaboration between RSE and local network operators, including mapping and monitoring pollution events, evaluating insulator performance under naturally polluted conditions and characterizing RTV and other innovative coatings aimed at enhancing the pollution performance of insulators.
Mapping Pollution Severity
Recently, the need has been recognized to update the pollution severity map of Italy and research using a suite of modelling tools for weather forecasting and air quality evaluation helped draft a replacement. Measurements of ESDD and NSDD, carried out according to strict methodologies at selected sites across the country, were used to support the research model. It should be noted, however, that ESDD and NSDD data obtained during sampling campaigns on site are not always representative of the maximum quantity of pollutants deposited on an insulator. Rather, they only express the deposit accumulated from the last precipitation event until the sampling day.
Since mapping should ideally represent the maximum pollution level in any given area, an algorithm was developed to reconstruct maximum deposit level, starting from measured ESDD and NSDD values. This algorithm is based on the concept that, given a certain constant daily pollution accumulation, total pollution deposited on an insulator is the result of accumulation that occurred during the sampling period, adjusted for precipitation events that wash out a fraction of the deposit proportional to their intensity. If x is the unknown daily ESDD (expressed in (mg/cm2/day), ESDDtn is the ESDD measured at time tn, is the ESDD reduction coefficient as a function of precipitation event intensity (mm/day) 0, tdryi is the interval (in days) between two precipitation events and tdryn is the time elapsed from the last precipitation event (before sampling), then x can be expressed as:
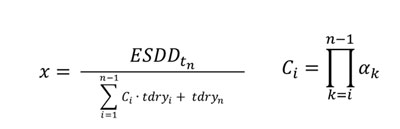
Once x is established, maximum ESDD accumulation between two samplings is obtained by multiplying parameter, x, and maximum number of dry days (i.e. days with precipitation less than 2 mm/day) over the sampling period. Fig. 1, for example, shows distribution of Site Pollution Severity (SPS), according to IEC 60815, obtained during the first 5 ESDD and NSDD sampling campaigns and re-calculated using the above algorithm. Heavy to very heavy pollution levels were detected, especially during the first and last sampling campaigns, which were characterized by higher precipitation.

Evaluating Insulator Performance Under Naturally Polluted Conditions
Mitigating the effects of pollution on performance can be achieved by using insulators with better pollution withstand characteristics, such as polymeric insulators, by applying surface treatments such as RTV silicone coatings to glass and porcelain cap & pin insulators or by intervening with cleaning. In this context, knowing and predicting the condition of insulating surfaces in real time allows for more effective planning of surveillance and maintenance programs.
For example, in the case of Italy, a pollution test station developed by TSO, Terna, in cooperation with RSE, was installed at a 150 kV substation located in Portoscuso, along the southern coast of Sardinia. This location was considered ideal since it recreates the severe salt pollution conditions found at several coastal sites across Italy, where strong sea winds frequently deposit salt on insulators. This laboratory extends over about 250 m2, where a typical 220 kV gantry was erected with 12 m height. Three single-phase inductive power transformers (IPTs) in reverse mode (i.e. supplying from their low voltage windings) are used to energize the test samples. Fig. 2 shows a schematic of the test gantry.

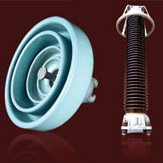
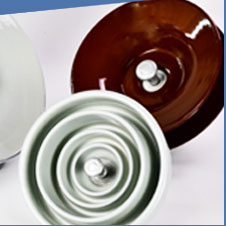
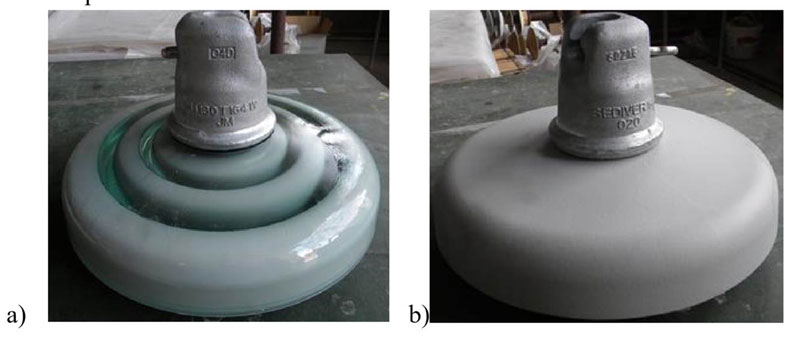
Four different types of insulators are tested here: uncoated glass cap & pin insulator strings; uniformly RTV-coated glass insulator strings (see Fig. 3b); partially coated (bottom side only) glass insulator strings (see Fig. 3a); and composite insulators.
Insulator leakage distances have been intentionally shortened with respect to design values normally expected for this site with the goal of accelerating any surface ageing phenomena. In particular, the following leakage distance values are used on the three phases of the system: L1 (2660 mm); L2 (3035 mm); and L3 (3385 mm). Reduction in leakage distances was achieved either by reducing the number of cap & pin discs in each string or by short-circuiting part of the profile of the composite insulators. Preliminary results showed that leakage currents on glass insulators were significantly higher than those on insulators coated with RTV. Among the latter, current amplitude was higher on insulators with partial coating of their surface. To better analyse number of significant pollution events (i.e. events characterized by a high transfer of charge responsible for erosion), Fig. 4 shows number of events exceeding 10 mA, categorized per class of maximum leakage current, for all insulator types tested between June 2017 and Oct. 2018. Data refers to Phase L3 characterized by longest leakage distances. It should be noted that number of events on glass insulators is at least one order of magnitude higher than for insulators having silicone on their surface, whether coated or polymeric housings.
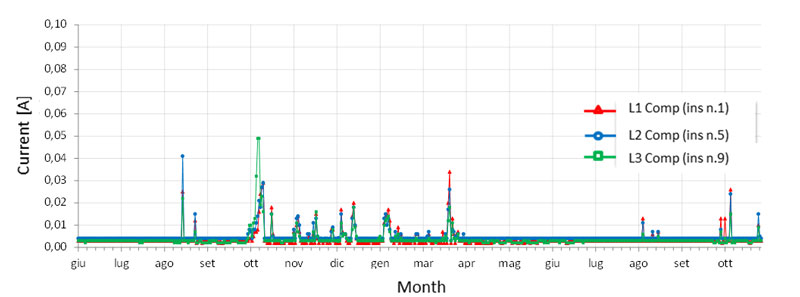
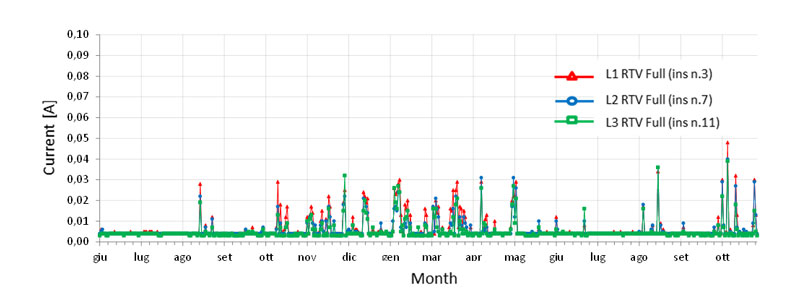
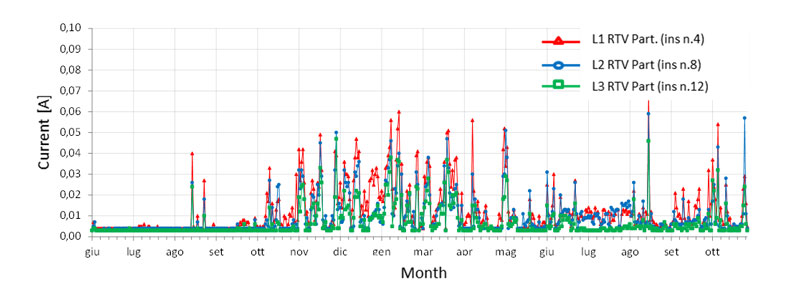
Figs. 5 to 8 show trends in leakage current peaks as a function of time (from June 2017 to Oct. 2018) for the different configurations tested. Note that the full scale of glass insulators was 10 times higher than other types. Number and intensity of events on insulators with partial RTV coating coverage was generally much higher compared to fully coated insulators.

The much higher level of pollution activity experienced on uncoated glass insulators is also evident from photos taken with a high sensitivity camera installed on the gantry (see Fig. 9). In the case of uncoated glass insulators, discharge phenomena are visible even during daytime.

Complementing observations from the natural pollution laboratory, assessment of long-term performance of partially and fully-coated insulators was carried out through systematic sampling of coated insulator strings from service followed by laboratory testing. The aim was to attempt detecting some property that can be related to ageing in order to better diagnose residual service life. The procedure is based on flashover voltage tests followed by hydrophobicity-recovery tests and was carried out according to the following test sequence:
• Measurement of degree of hydrophobicity (acc. to method STRI 92/1);
• Measurement of ESDD and NSDD on two insulators of string (live side) acc. to procedure in IEC 507:1991 or EN 60507:1993;
• Measurement of minimum flashover voltage according to ‘rapid flashover method’, carried out using clean fog on naturally polluted insulator strings;
• Measurement of flashover voltage acc. to ‘quick flashover method’ (i.e. salt fog);
• Measurement of level and trend of recovery of degree of hydrophobicity (acc. to method STRI 92/1).
The above-described test procedure was applied to pre-coated glass cap & pin insulators removed from eleven HV and EHV overhead lines after 8 to 10 years of service. Results show that flashover tests are sensitive to both degradation on insulators and to years of service and therefore offer valuable information on insulator condition. Moreover, hydrophobicity recovery is a simple method to infer information on both residual life and reliability.
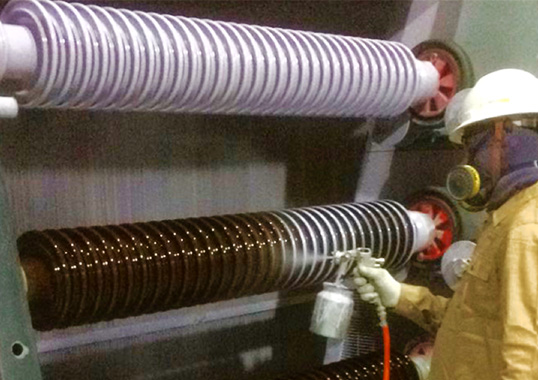
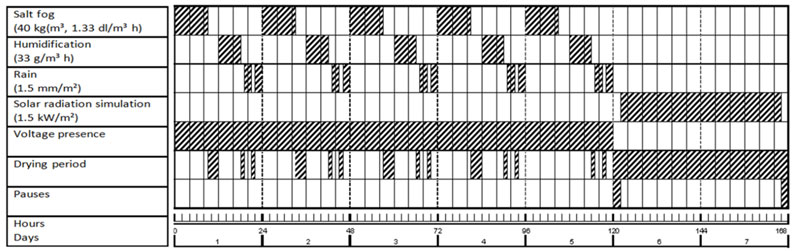
A final step toward complete assessment of performance of partial and fully coated glass insulators involved a multi-stress ageing test. A special set-up was installed in the pollution chamber at RSE (see Fig. 10) designed to simultaneously carry out this test on 6 insulator strings, each equipped with 6 cap & pin units having partial and full RTV coatings (i.e. three fully coated and three partially coated. The strings are installed with three different orientations: vertical; inclined 54° to represent a V-shape line configuration; and horizontal at 15°, representing a tension configuration. Environmental stresses are applied according to a weekly cycle (see Fig. 11). Five days a week, phases of salt-fog, humidification and rain are applied, always in the presence of voltage. The remaining two days see radiation applied through lamps whose spectrum reproduces solar radiation. Salt fog salinity is set at 40 kg/m3 while the humidification phase is achieved by steam fog with production rate of 33 g/m3h. Precipitation rate during the rain phase is 1.5 mm/m2 and solar radiation has an intensity of 1.5 kW/m². Direction of radiation must be perpendicular to insulator axis, while also ensuring that temperature reached on insulator surfaces under test due to the radiation’s infrared component never exceeds 60°C. No voltage is applied during this phase since this would interfere with presence of the lamps while not producing any leakage current given that insulators are dry.

Monitoring Systems
Since the end of the 1990s, different equipment has been developed, tested and installed in Italy, starting with the first generation AMICO (Artificially Moistened Insulator for Cleaning Organization). This device simulates and forecasts impact of natural wetting on an insulator under actual pollution conditions and as such provides an alert allowing time for appropriate countermeasures. The second generation AMICO DC is lighter, sturdier and easier to maintain, while also being more flexible and suitable as well for DC applications. Another way to monitor insulator behaviour is with the ILCMS (Insulator Leakage Current Monitoring System), developed to measure leakage current on line and post insulators in service and correlated with meteorological information from a weather station. Current data are measured with the high sampling frequency of > 40 kHz, which allows not only detecting peaks but also acquiring waveforms of the signals being monitored. These characteristics of the AMICO and ILCMS make the two complementary in terms of characterizing site pollution severity as well as relative performance of different types of insulators.
The importance of dynamic monitoring of pollution build up on insulators in several regions of Italy at typical altitudes of line insulators lead to development of the McMel (Miniaturized Conductance Meter for Electric Lines). This device, shown in Fig. 12, is made up of four inclined glass surfaces with inclination of about 20° (i.e. similar to inclination of cap & pin insulator strings). Each surface can be cooled by a Peltier cell and is equipped with electrodes capable of measuring conductivity of the deposited contamination layer. Measuring all surfaces allows classifying, by cardinal direction, any unevenness in contamination deposits as well as preferential direction of deposition. Data is correlated with environmental parameters from a compact meteorological station.
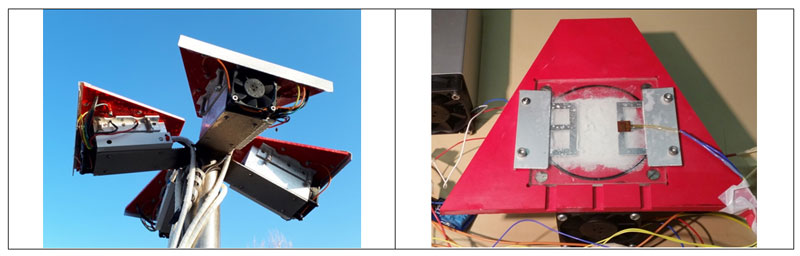
The McMel device takes into account the washing effect of rain and dew. Moreover, above all else, it allows for remote daily monitoring of contamination level on insulating surfaces without need for personnel on site. A PLC system is used to manage automatic measurement of conductivity on all four surfaces of the device. This is supported by a series of peripheral cards for remote communication and data download. In particular, software has been developed that guarantees hourly measurement of conductance under natural conditions and also, once each day, measurement of surface conductance under conditions of forced humidification using the Peltier cells (as with AMICO devices).
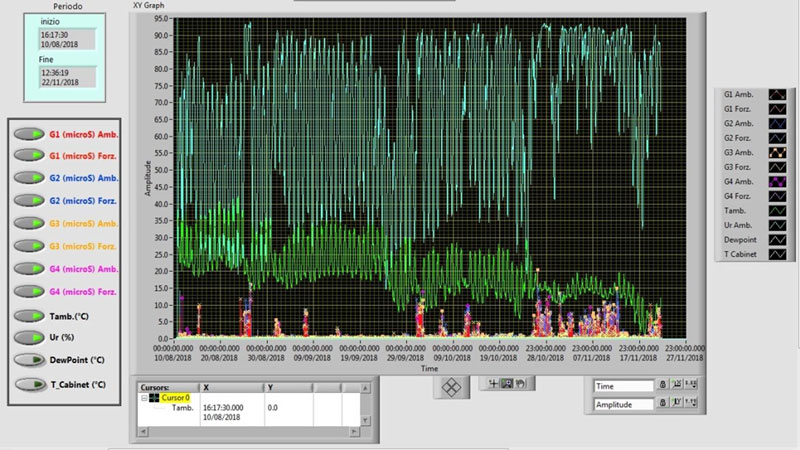
A series of tests carried out in the laboratory applied low DC voltage on the electrodes and acquired surface current from the electrodes themselves during forced humidification. In the first phase, in a site sheltered from atmospheric precipitation, surfaces were contaminated with a known salt deposit. Repeated tests of humidification and measured conductivity were then conducted to verify repeatability of measurement as well as preservation of the pollutant (i.e. without run-off from measurement surfaces). This allowed verifying constistency of measurements – even after more than 90 humidification cycles (May 2018 to Aug. 2018), carried out almost daily. After this phase, the device was installed in an RSE site open to the atmosphere to verify functionality of the device in a natural environment. Fig. 13 shows the panel of the McMel device displaying conductance and environmental data detected between Aug. and Nov. 2018. Conductance values detected are particularly low, especially considering the high rainfall of this period.
Innovative Materials & Coatings to Enhance Insulator Pollution Performance
RTV coatings are based on the principle of enhancing hydrophobicity, thereby avoiding formation of a continuous film of pollution on an insulator surface. But an entirely different way of thinking was also considered, this time using hydrophilic treatments to give glass insulators enhanced self-cleaning or repulsion of dust (i.e. an anti-static effect) or degradation of accumulated organic deposits (i.e. a photo-catalytic effect). A set of glass cap & pin insulators was produced using three types of coatings implementing these features. Moreover, all surface treatments preserved the transparency of the glass insulator. These treatments can be categorized as:
• Treatment n. 1: Ultraviolet photocatalytic coating made of self-cleaning material;
• Treatment n. 2: Photocatalytic coating capable of breaking down organic grime;
• Treatment n. 3: Photocatalytic mineral coating that oxidizes organic micro particles when irradiated by UV light.
Initial characterization was carried out to verify whether these hydrophilic coating treatments have a negative impact on insulator performance before addressing any possible advantages. This was done by means of salt fog tests that saw determination of average flashover voltage using the ‘rapid flashover’ test method (according to CIGRE Brochure 481 with salinity 80 kg/m3) and also by solid layer test that determined average flashover voltage using the ‘rapid flashover’ method. ESDD levels for these tests were 1.4 mg/cm2 and 0.2 mg/cm2 respectively. Testing compared dielectric performance to that of standard, uncoated cap & pin insulator strings of similar profile. Tables 1 and 2 summarize values of flashover voltages as a percentage of that of the uncoated string.
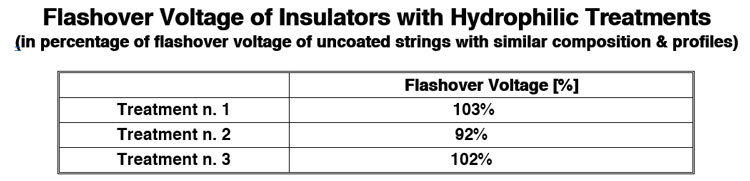

Coated insulators show different behaviour for the two types of test:
• salt fog tests showed performance reduction of almost 10%;
• improved performance was noted with the solid layer test, where the benefits of better self-cleaning can be better demonstrated. Treatment n. 1 showed good performance for both levels of surface contamination (ESDD).
During testing of all types of surface treatments, the flashover arcs experienced caused localized removal of the coating but did not affect overall insulator performance. This experience is still at an initial phase and full characterization should involve many more test samples. More specifically, it will also need to address long-term performance to infer eventual ageing phenomena. Future activities foreseen in this research include studying coating adhesion and enhancement, short and long-term flashover performance under different environmental conditions and characterization of surfaces using different types of physical and chemical analyses. If found relevant, results will be reported in a future RSE publication.
Conductor & Ground Wire Issues
Extreme meteorological events with high intensity and covering wide geographic areas are becoming ever more frequent. For example, in Italy, numerous intense rainfalls have caused flooding that destroyed essential infrastructure. Moreover, heavy snowfalls, characterized by high water content sticky wet snow, have caused battles to save electrical lines from mechanical overload and collapse. Indeed, wet snowfall is considered the most critical event for overhead line conductors and ground wires and is therefore a topic of special attention among network operators as well as by regulatory bodies. Several R&D projects are ongoing in collaboration with stakeholders such as Terna and eDistribuzione and also involving conductor and ground wire manufacturers. Their goal is to identify and validate alternative measures to mitigate the effect of climate change on electrical systems.
Evaluation of Performance of Snow & Ice-Phobic Coatings for Conductors
Several methods can be envisaged to limit the risk of mechanical failures of overhead lines under wet snow events:
• replacing line spans with underground cable;
• increasing transmission system meshing and back-supply capability thereby avoiding supplying substations with lines in ‘antenna’ configurations;
• limiting accretion of snow sleeves using hydrophobic or ice-phobic surface treatments or coatings on conductors;
• applying anti-rotation devices such as pendulum de-tuners, wind dampers, torsional damper de-tuners and even interphase spacers, as used to reduce risk of conductor galloping;
• increasing surface temperature of conductors to avoid sleeve build up by some minimum anti-icing current.
While all above options are being studied, the focus here is on research related to evaluating performance of different treatments and coatings applied to reduce or delay snow sleeve formation or to facilitate shedding before load becomes a threat.
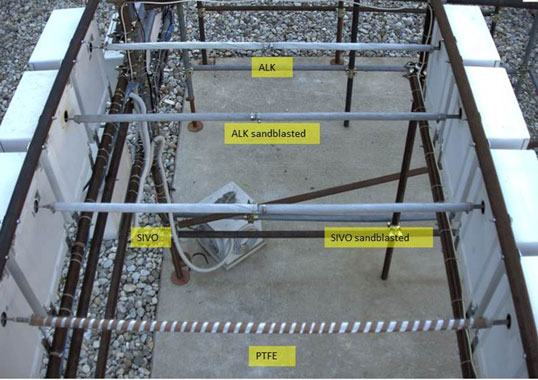
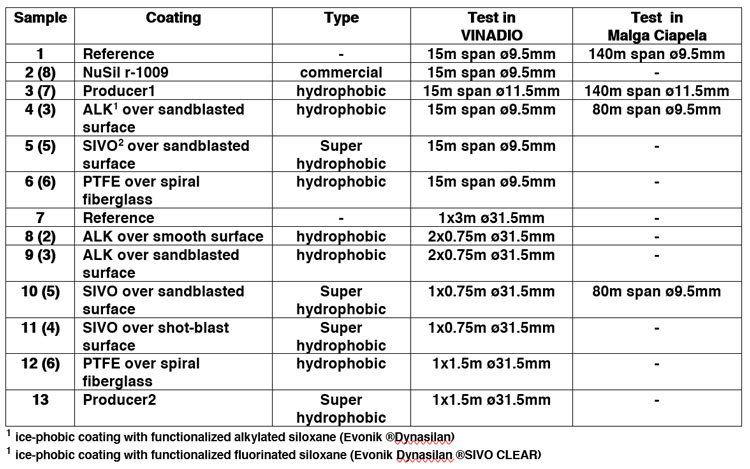
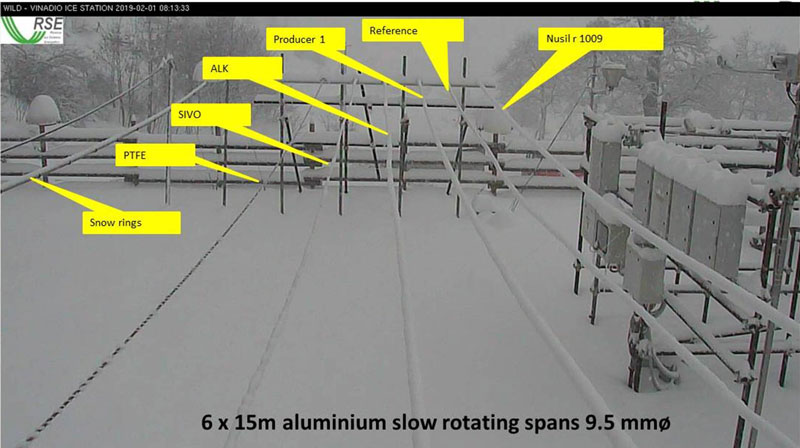
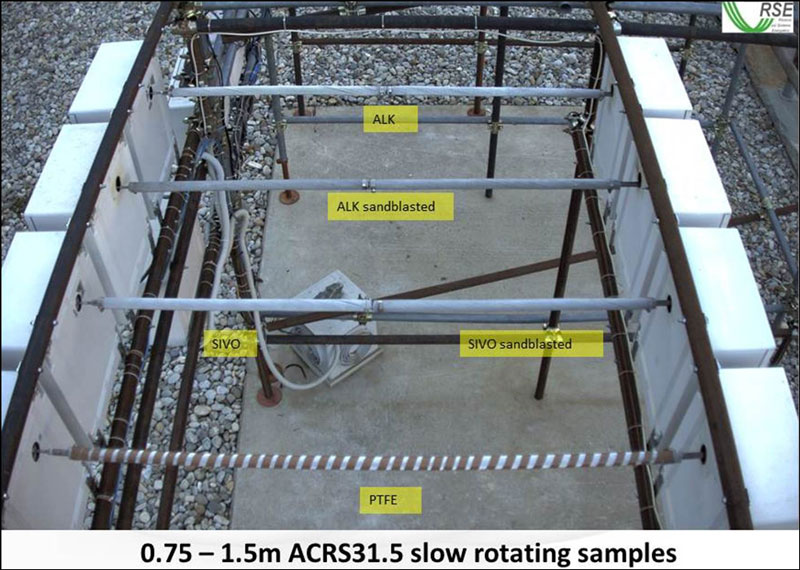
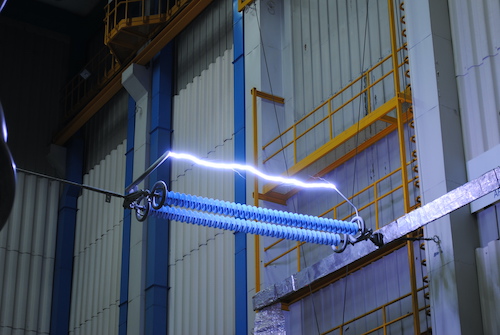
Different types of solutions have been considered, some developed in RSE laboratories using surface treatment and subsequent coating application, others involving commercial varnishes or tapes, and still others using experimental treatments developed by conductor manufacturers. All were then compared to reference untreated samples. Evaluation of relative performance was done on laboratory samples and also on site at Vinadio as well as at an experimental set-up in Malga Ciapela for long spans. Table 3 summarizes specimen tested as well as specific surface coatings while Figs. 14 and 15 show test configurations adopted in Vinadio to carry out tests on coatings under natural conditions for both short and medium size spans. Fig. 16 shows the configuration of coated ground wires at Malga Ciapela.

One issue was how best to compare relative snow sleeve behaviour of different types of conductors. Given the absence of a normative reference, two metrics were established to quantify snow sleeve build up along the conductor axis and to estimate its growth in terms of mechanical load. Test sites were equipped with automated video cameras that record images of all samples at 15 minutes intervals. In addition, meteorological parameters such as temperature, wind speed and direction, precipitation rate, etc.) are continuously monitored. A load cell records weight of reference conductors (i.e. samples 1 and 7 for the short and medium spans respectively). Two metrics were set up:
• Relative Coverage (Rcov)
Snow sleeve build up was measured in terms of length of conductor covered by the sleeve. Each photographic image was analysed and a coefficient was assigned to each sample, expressing fraction of surface that appeared covered by a snow layer, independent of diameter of snow sleeve. A ‘qualitative’ number in the range 0-1 (cov) expresses if the wire is free of snow (zero value) or completely covered or any intermediate value. The figure of merit for coverage was obtained as sum of all cov values in each time slot and normalizing this total with respect to the reference sample. This relative coverage number (Rcov) is lower than 1 for samples performing better than the reference or greater for samples that perform worse.
• Maximum Relative Load (MRL)
An Estimate Relative Load (ERL) value representing load of snow accreted at time, n, (ERLn) can be calculated from coverage (cov) and precipitation rate (PR) data, adding the load already present on the sample at time n-1 or subtracting amount that shed, as follows:
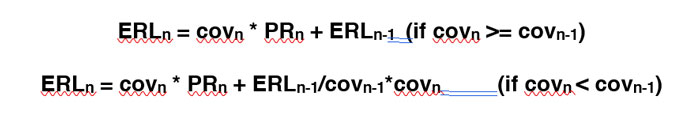
The MRL is obtained taking into account maximum ERL value reached by each sample in any given event relative to the reference sample
Table 4 reports results obtained during the 2018/19 winter campaign at Vinadio natural test station. Two subsequent snowfalls occurred respectively on Feb. 1-2 and Feb. 2-3.

This data show that PTFE (sample 6), and SIVO (samples 5 and 11) performed better than other samples during Event n. 1 (dry snow). ALK coatings (samples 8, 9) showed best behaviour in terms of coverage during Event n. 2 (wet snow), whereas SIVO (samples 5 and 11) showed minor MRL values. Samples sometimes performed worse than the reference. Data related to these single events are scattered, showing differences between short and long samples (conductors and ground wires). It is therefore difficult to clearly recognize best performing categories even if some correlation with temperature, precipitation rate and wind is evident during detailed analysis. Table 5 reports on observations at Malga Ciapela test site during four snowfall events occurred in Feb. and Apr. 2019 respectively.
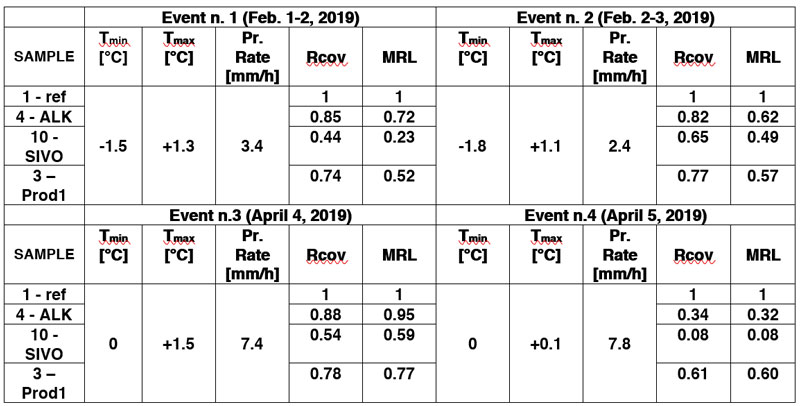
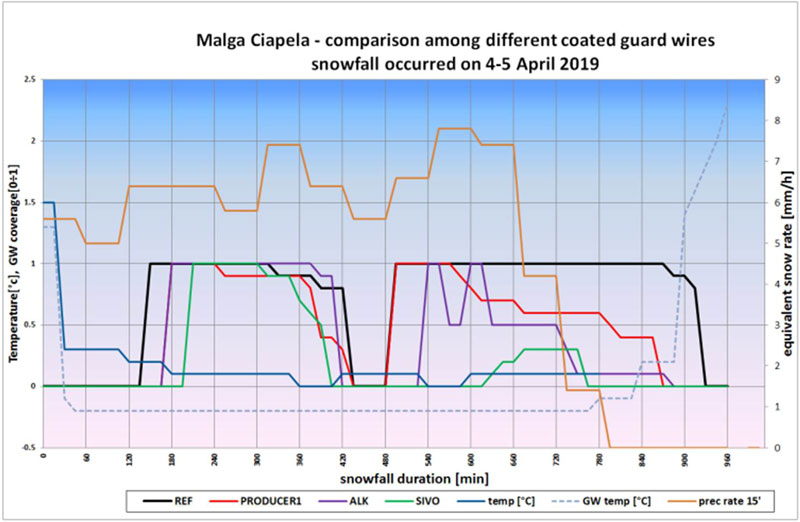
Fig. 17 reports on time trend of snow sleeve formation and detachment during events n. 3 and n. 4. Coated samples performed better than the uncoated one, especially 6 hours from the start, when SIVO considerably delayed accretion during the event even though precipitation rate was over 6 mm/h. Also ALK and Producer1 performed well, showing early sleeve detachment compared to the uncoated reference.

Summary & Conclusions
Surface contamination on insulators and wet snowfall are growing threats to the integrity and reliability of electrical systems. A direct effect of climate change affecting the entire planet, these are particularly important over the Mediterranean and in Italy.
Several measures can be envisaged to limit the impact of these potentially dangerous stresses. The above discussion has addressed mitigation effects of coatings applied on line insulators to enhance pollution performance or on overhead line conductors to limit accretion of snow sleeves as well as to promote shedding before mechanical load becomes too high. Pollution monitoring systems offer significant help, not only in mapping of contamination but also in alerting operators with a view to predictive maintenance operations. Efforts must be made to extend validity of the data acquired through environmental modelling and the wide diffusion of low cost devices. Application of composite insulators and coating cap & pin insulators with RTV hydrophobic films or other hydrophilic coatings can enhance performance of lines under pollution events. Partially coated RTV cap & pin insulators have demonstrated some interesting features that make them competitive with respect to fully coated or even composite insulators. Moreover, super hydrophilic coatings have potential to better foster self-cleaning, thus avoiding pollution build-up.
Coatings can enhance anti-icing and anti-snow characteristics of conductors and ground wires. Several solutions were tested and comparative results are discussed. Tests on full-scale lengths seem to show clearer and more homogeneous results than for short specimens such as those mounted at the test station in Vinadio. Different types of coatings behave differently upon temperature variations of even a few degrees Celsius, both under wet and dry snow. Moreover, mechanism of mitigation can be different – for example either by delaying adhesion of the first snow film or accelerating shedding of accreted sleeves. Comparison of laboratory and field data demonstrates that behaviour of coatings under real conditions is not entirely straightforward based only on laboratory findings. More research is needed and the work described above is an initial step to guide its direction.
Acknowledgements
This work has been financed by the Research Fund for the Italian Electrical System in compliance with the Decree of Minister of Economic Development April 16, 2018. Part of the work has been conducted in the frame of collaboration agreements with important stakeholders such as the Italian TSO (Terna SpA), insulators, conductors and coating producers. This type of collaboration is deemed of fundamental importance for the research activities of RSE, directly confronted to real network operation and maintenance aspects, real life testing locations, natural pollution sites and laboratories, materials and industrial scale processes. Our deep appreciation and sincere thanks are expressed to Terna personnel for the continuous support to the research in this strategic field of development. This paper is the result of the collaboration of several RSE researchers and demonstrates the capabilities of specialists from different cultural and scientific backgrounds to exchange information and work together towards a common goal. Special thanks to Marcella Balordi, Cristina Chemelli, Emanuele Ciapessoni, Paola Faggian, Matteo Lacavalla, Pietro Marcacci, Giovanni Pirovano, Guido Pirovano, Dario Ronzio and Anna Maria Toppetti.
References
[1] M. de Nigris “Impact of Environmental Constraints on Electrical System Development and on Insulation Trends” 2017 INMR World Congress Barcelona. https://www.inmr.com/impact-climate-change-power-systems-electrical-insulation-experience-italy/5/
[2] CIGRE, «Application of weather models for the evaluation of design ESDD for harsh pollution conditions,» Special Report for SC D1, 2014;
[3] IEC/TS 60815, «Selection and dimensioning of high-voltage insulators intended for use in polluted conditions,» ISBN-2-8318-1015-4, 2008;
[4] G. Pirovano, M. Forteleoni, P. Berardi, V. P. Licciardi e M. Marzinotto, «Development, design and installation of a new naturally polluted insulator testing station,» in 2nd South East European Regional CIGRE Conference, Kiev, 2018;
[5] M. Marzinotto, E. A. Cherney, G. Mazzanti, G. Pirovano «An Innovative Procedure for Testing RTV and Composite Insulators Sampled from Service in Search for Diagnostic Quantities», IEEE Transactions on Power Delivery, TPWRD-00028-2018;
[6] G. Pirovano «Monitoring Pollution Levels of Line & Substation Insulators» – 2015 INMR World Congress Munich 18-21 October 2015 http://www.inmr.com/advances-monitoring-pollution-line-substation-insulators/
[7] P. Faggian, R. Bonanno, G. Pirovano «Research activities to cope with wet snow impacts on overhead power lines in future climate over Italy» – Int. Workshop on Atmospheric Icing of Structures IWAIS 2019 – Reykjavík, June 23 – 28;
[8] M. Balordi, A. Cammi, C. Chemelli, P. Marcacci, G. Pirovano, G. Santucci de Magistris «A comparison of anti-ice and anti-snow coatings performances: laboratory and field testing» – Int. Workshop on Atmospheric Icing of Structures IWAIS 2019 – Reykjavík, June 23 – 28;
[9] P. Marcacci, M. Lacavalla, G. Pirovano «Monitoring, measurements and mitigation for wet snow accretion on overhead conductors» – Int. Workshop on Atmospheric Icing of Structures IWAIS 2019 – Reykjavík, June 23 – 28;