In this edited contribution to INMR, Prof. Guan Zhicheng (retired) of Tsinghua University Shenzhen Campus argues that properly characterizing and measuring the pollution affecting overhead lines and substations is of great importance when specifying insulators to minimize risk of pollution flashover.
While there are several relevant parameters to assess pollution severity, the most common are equivalent salt deposit density (ESDD), leakage current and surface conductivity – each with its own relative advantages and drawbacks.
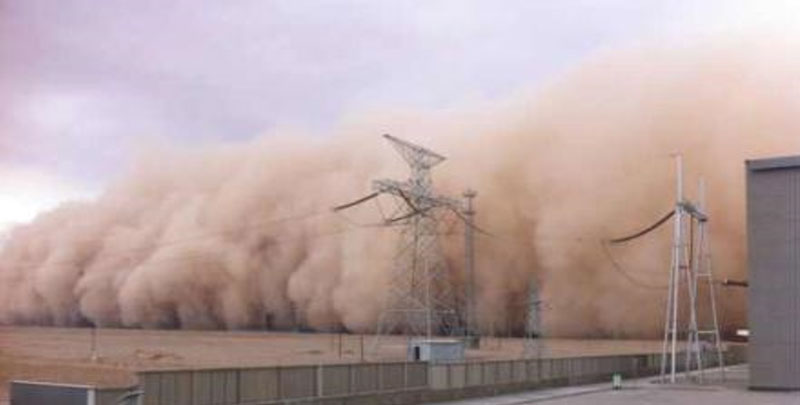
Measuring ESDD is the most popular and allows pollution maps to be correlated with appropriate insulator selection criteria for each pollution zone. Unlike ESDD, which aims to characterize the amount of pollution deposited on insulators, surface conductivity reflects both pollution deposition and wetting that impacts an insulator. Leakage current, by contrast, is a pollution severity parameter that is easy to monitor on-line, under dry band conditions that result from the combined effects of pollution, wetting and operating voltage.
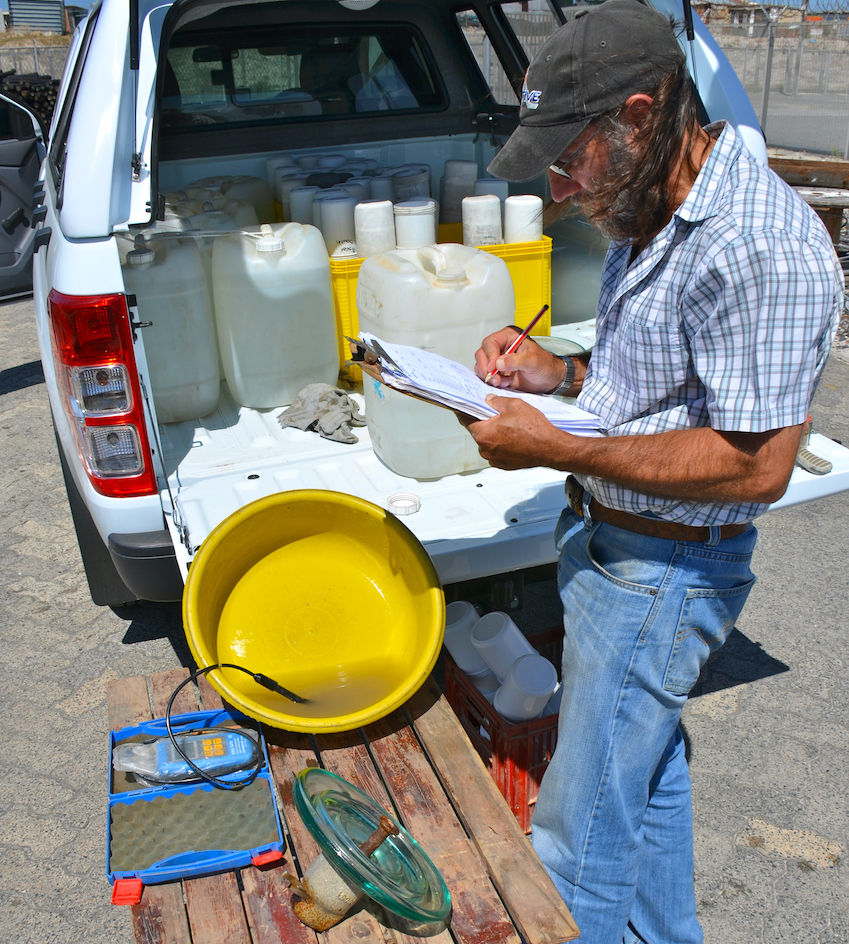
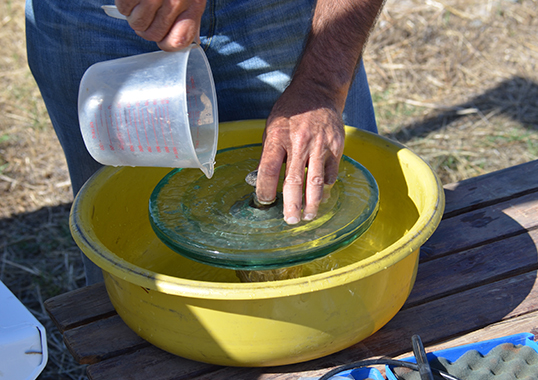
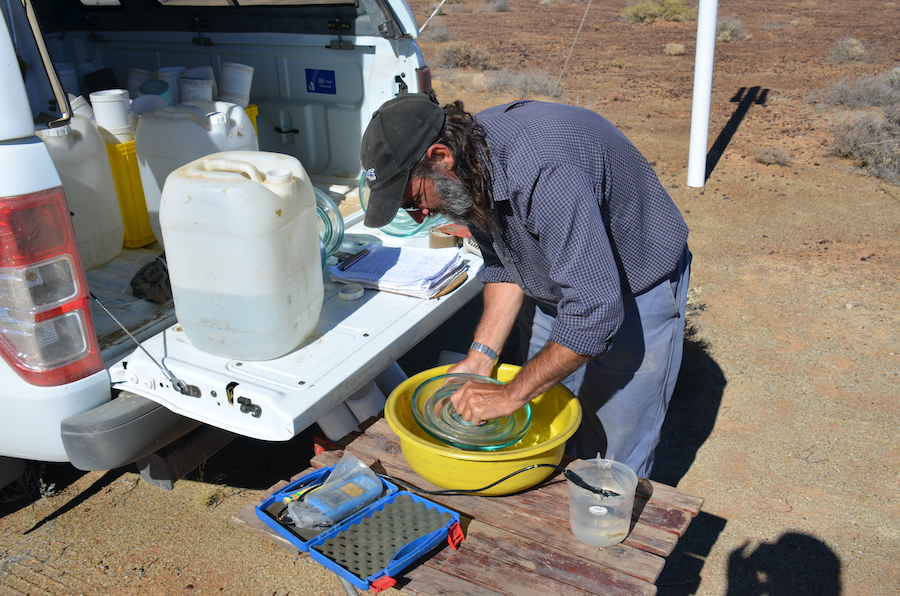
The widespread use of ESDD as a parameter to characterize pollution severity is due largely to its simplicity, without need for expensive measuring equipment. The applicable methodology involves washing pollution deposits from the insulator surface with a specified volume of de-ionized water. Conductivity of the resulting solution is measured and, after correction to a standard temperature, equivalent effective salt content needed to arrive at this conductivity value can be calculated.
ESDD has been used for years as an insulator selection tool by power supply utilities and this parameter is applied across the globe with large amounts of accumulated data. In China, for example, it has also become the primary basis for quantitatively plotting pollution levels across the country and influencing decisions on required insulation levels. Indeed, utilities there regularly measure ESDD and, if necessary re-plot pollution level in each area based on the values obtained. The insulation configuration of affected transmission lines and substation equipment is also adjusted accordingly.
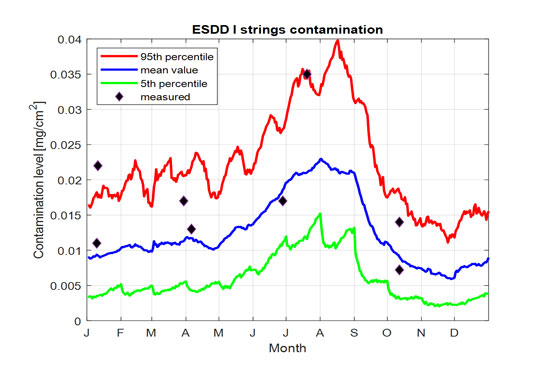
In recent years, several refinements have been made to improve plotting pollution based on ESDD. For example, it has been proposed that this should be done based rather on accumulated ESDD values over years (referred to as ‘saturated ESDD’) than on only one value measured each year. Pollution area plotting based on saturated ESDD levels is more practical, given the impossibility of washing every year, and also allows operators to specify greater insulation margins.
Research has confirmed that Non-Soluble Deposit Density (NSDD) also impacts pollution flashover voltage of an insulator. Moreover, since the effects of NSDD and ESDD are largely independent, pollution area plotting must also take this parameter into consideration. In fact, pollution mapping must be comprehensive and based on several factors, including service experience and presence of relevant wetting phenomena. These are even more important factors to consider than ESDD value alone, which should serve mostly as a reference. But since service experience and pollution wetting are mostly qualitative, the role of ESDD has perhaps been accorded too much importance due to it being quantifiable and easy to measure.
ESDD as a parameter also suffers from the fact that its value does not necessarily correspond directly to insulator pollution flashover voltage. This is because the composition of soluble salts in natural pollution can be complex. For example, numerous measurements across China have shown that soluble salts in the pollution in many areas are dominated by calcium sulphate (CaSO4), which is relatively difficult to dissolve. Since the volume of water specified in ESDD measurement methodology is high, any CaSO4 present dissolves and contributes to conductivity of the solution. However, in reality, insulators in service are under a state of ‘saturated wetting’. The quantity of water on their surfaces is small and generally equals only about one percent of that used during an ESDD measurement. With such a small quantity, only little CaSO4 is dissolved. The majority does not contribute to solution conductivity and therefore will not directly correlate to pollution flashover voltage.
Artificial pollution testing uses sodium chloride (NaCl) to simulate soluble salts. That is the reason why, even with the same ESDD, pollution flashover voltage of a naturally polluted insulator is often much higher than for an artificially polluted test sample. Moreover, since soluble salt compositions can vary significantly by region, pollution flashover voltage testing of natural samples having the same ESDD value can see high dispersion in data. Indeed, the most important criterion to assess whether any parameter describing pollution severity is suitable or not is whether it correlates closely to pollution flashover voltage. This is something that ESDD unfortunately lacks.
To overcome some of these negatives using the ESDD measurement method, researchers have analyzed the chemical composition of soluble salts in natural pollution deposits. They then ‘corrected’ the ESDD value obtained using the traditional methodology based on the percentages of monovalent and bivalent salts in the soluble layer. These corrected ESDD values, referred to as ‘effective ESDD’, more closely correlate to pollution flashover voltage.
Unfortunately, chemical analysis of ingredients within soluble salts on insulators in service is costly and time consuming. Moreover, it is virtually impossible to do such an analysis for each ESDD measurement taken. For this reason, the concept of ‘effective’ ESDD has not become popular. Still, it seems clear that to achieve high correlation of ESDD values with pollution flashover voltages requires additional work. This is not to negate the value of ESDD but rather to ensure that users better understand its relative benefits and weaknesses.

