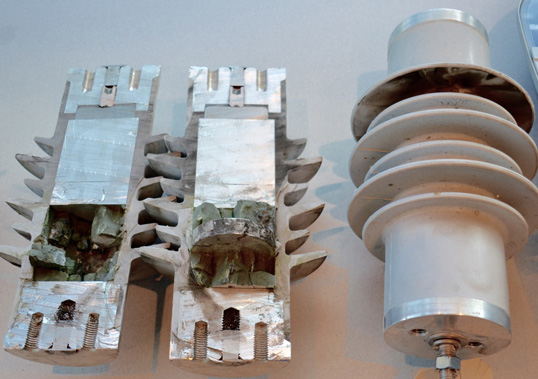
Increased automatic reclosures recorded on the Czech power system in past years were classified as ‘unexplained’ since they were not caused by lightning or flashover to external objects such as trees. To investigate possible causes, different types of insulators were removed from towers where such unexplained automatic reclosures (UARs) had been recorded. These were subjected to laboratory tests to verify electrical properties, including withstand voltage and pollution flashover performance.
This edited past contribution to INMR by Vaclav Sklenicka, retired from EGU HV Laboratory in Prague, analyzed UARs with a view to correlate them by time, service environment and ambient conditions. Influence of different type of insulator sets was also investigated.
Distribution of UARs by Time & Ambient Conditions
Fig. 1 shows the monthly distribution of UARs in the Czech Republic in past years while Fig. 2 depicts their distribution on selected 400 kV overhead lines by time of day. Dependence of UAR frequency on relative humidity is shown in Fig. 3 while relationship on ambient temperature and dew point can be seen in Fig. 4.
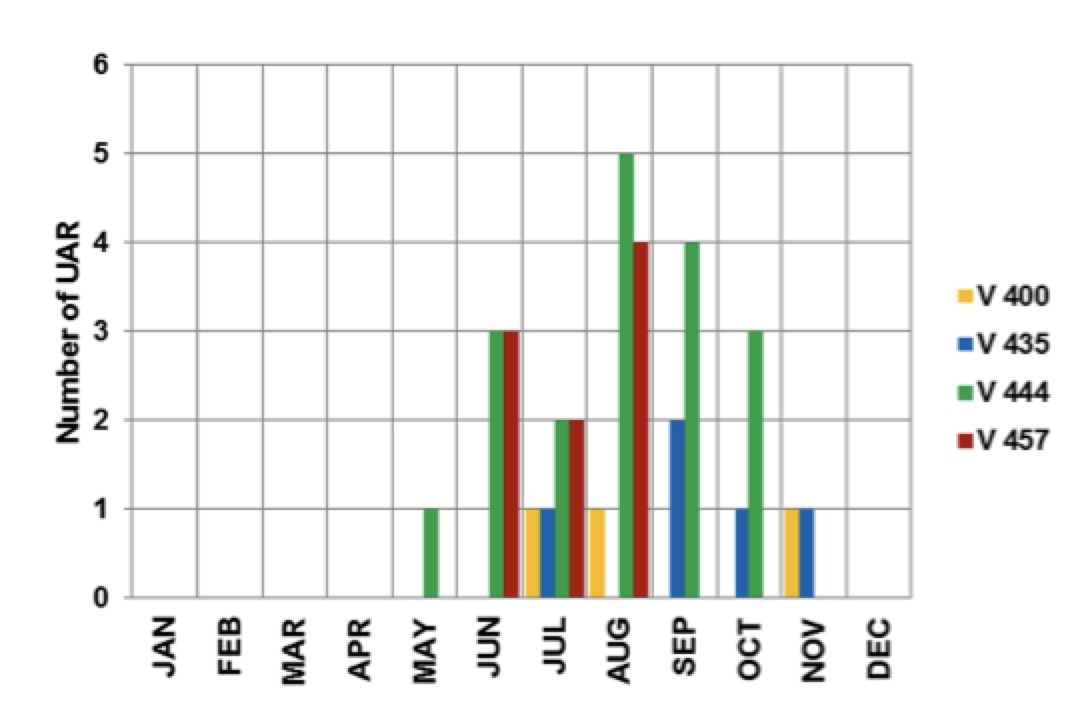
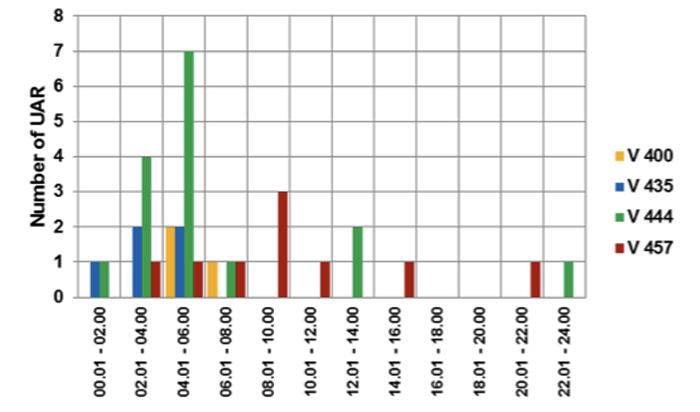
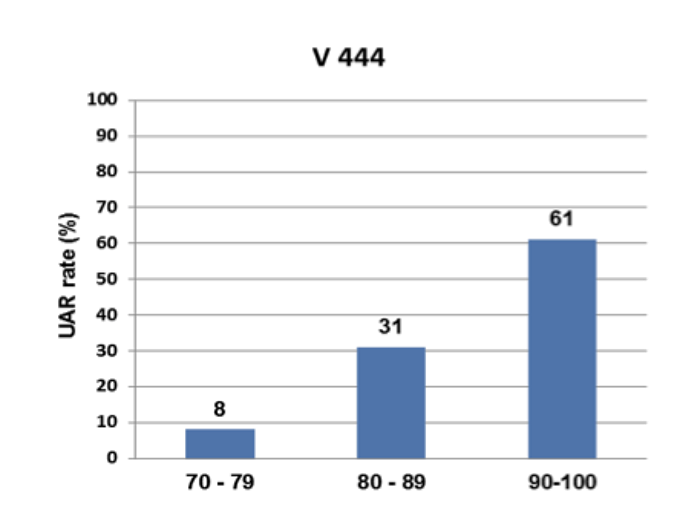
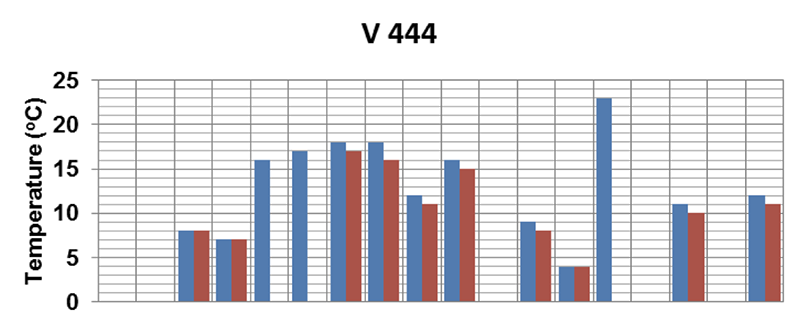
Analysis of time of occurrence of UARs confirmed results from similar investigations performed in other countries, namely that the highest numbers of UARs typically occur early in the morning and during the months from June to October. Moreover, Figs. 3 and 4 suggest that there could have been condensation on insulator surfaces at the time of these reclosures.
Voltages & Currents During UARs
Apart from other functions, an ACM monitoring system also collects and stores all records of failure at substations, including successful reclosings. These records are digital and consist of time waveforms of phase voltages and currents with time interval sampling of 1 kSa/s. In the case of successful one pole reclosing, this interval covers the time before appearance of a short circuit current, the short circuit duration as well as opening and reclosing of the failure pole. Fig. 5 shows such waveforms from the Czech power system. The same record in a time-expanded mode is shown in Fig. 6.
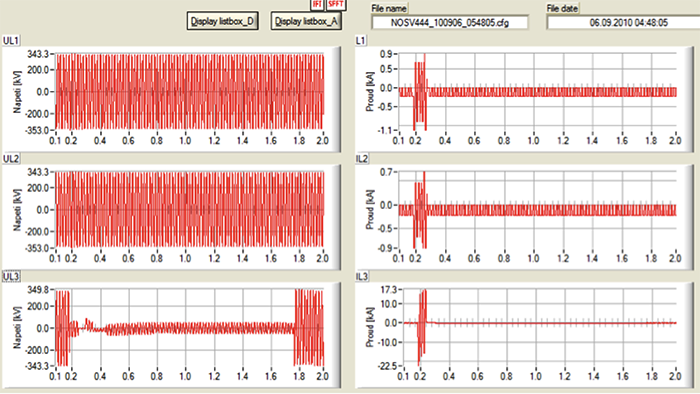
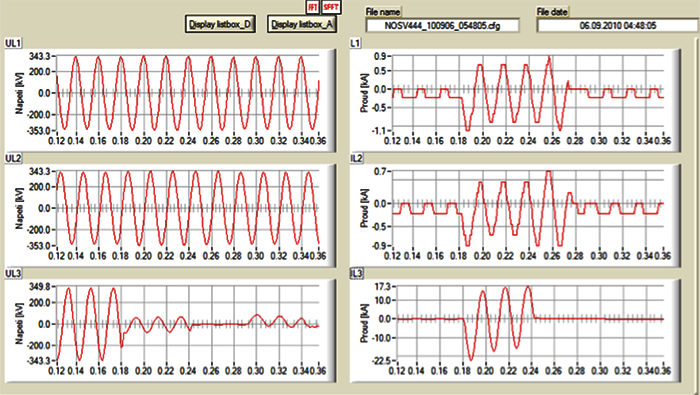
Analysis of these records from successful reclosings provided the following information:
• time waveforms of all voltages shortly before short circuit current inception, e.g. if the voltages were in full size and without sinus shape distortion;
• voltage level at moment of short circuit inception;
• magnitude of short circuit current;
• number of short circuit current periods;
• success of reclosure;
• voltage-free time interval;
• restoration of operating current after reclosure.
Evaluation of all these characteristics allowed the circumstances of any short circuit and the probable reasons behind its origin to be determined. With respect to this methodology, all relevant records were analyzed for reclosings (sometimes simultaneous) on lines V400, V435, V444 and V457, with the following conclusions:
1. All short circuits occurred under normal operating conditions with steady-state voltages as well as currents. They were not preceded by any lightning or switching overvoltage or by a drop/distortion of voltage or increase in current;
2. All reclosings were successful, with standard development and no deviations;
3. Flashovers occurred either at the voltage peak or before, basically independent of voltage level. This would suggest that the reason for the failures was external (e.g. flashover along a suspension insulator polluted by bird excrement).
Analysis of UARs by Type of Insulator
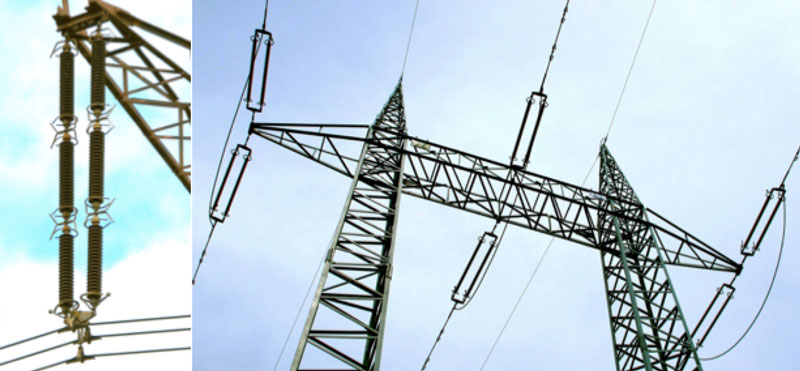
Czech transmission lines operate at 110 kV, 220 kV and 400 kV and are equipped with porcelain long rods, glass cap & pin strings or composite insulators. The majority of these lines operate in areas with only light to medium levels of pollution. Still, insulator sets are dimensioned for high pollution while meeting standard requirements for dry withstand lightning impulse and wet AC or switching impulse voltages.
For purposes of this analysis, only those automatic reclosures unambiguously allocated to a specific insulator type were taken into account. The analysis was performed in terms of automatic reclosure intensity, Λ, involving the following variables:
• number of automatic reclosures allocated to certain insulator type (porcelain, glass or composite) for a given period and system voltage, and
• number of strings assembled from these insulators
Figs. 7 to 9 compare the values of total reclosure intensity (Λtotal), intensity of reclosures caused by lightning (Λlight) and intensity of unexplained reclosures (ΛUAR) covering three consecutive years.
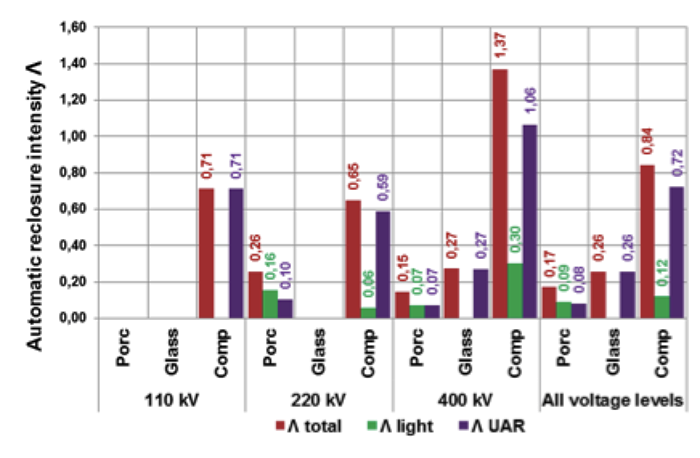
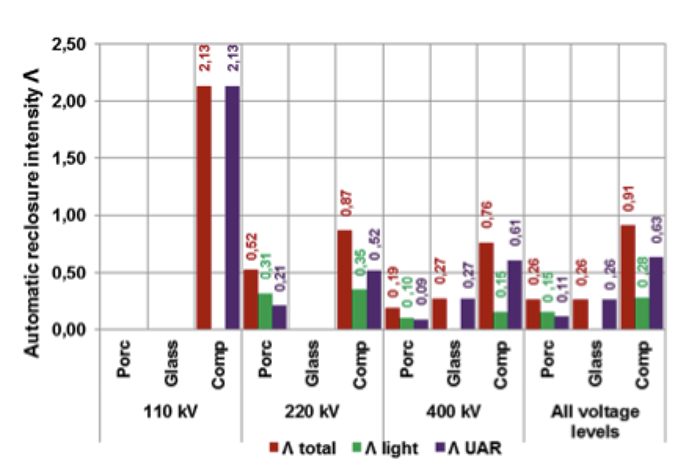
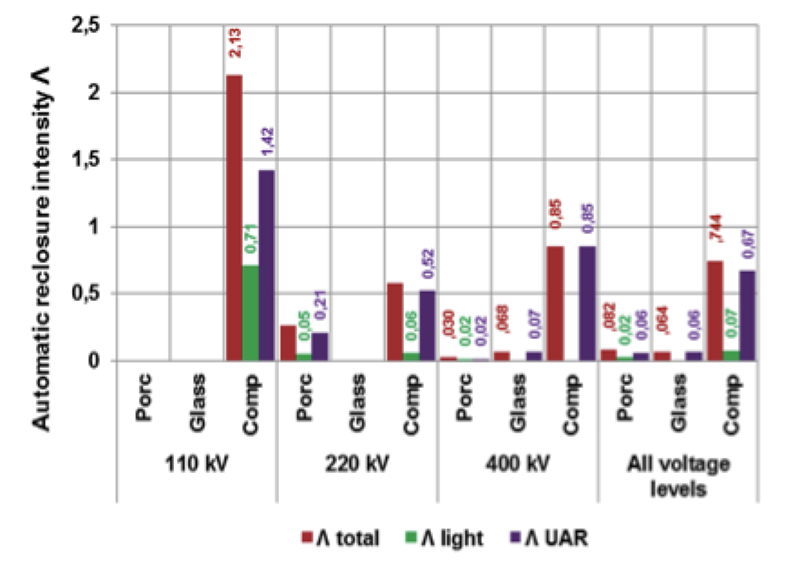
The percent distribution of individual insulator strings types and comparison of percentage distributions of unexplained automatic reclosures intensities related to insulator string types for all voltage levels are shown in Figs. 10 through 13.


Figs. 10 to 13 show that the intensity of automatic reclosures was highest on strings assembled from composite insulators. This conclusion is also supported by anecdotal service experience. For example, a significant increase in automatic reclosures was observed just after replacing porcelain insulator sets with composite types on towers where a line crosses roads (done to increase conductor clearance). Also, in three other cases, automatic reclosures occurred within only some tens of hours after a new line equipped with composite insulators was energized. One of the reasons for this could be different dry arcing distances. Table 1 shows typical dry arcing distances for different insulator sets used on Czech transmission lines.

Only in the case of 400 kV system voltage is the dry arcing distance of insulator strings assembled from composite insulators shorter than for other insulator types. For 110 kV and 220 kV, this distance is basically the same for all insulator technologies. Based on this, it does not appear that reduced dry arcing distance is the only reason for higher UAR occurrence on strings with composite insulator strings.
Conclusions from Analysis of UARs
Based on the above, the following points were noted:
• No atmospheric overvoltages (lightning strokes) nor switching overvoltage’s occurred at the time of UARs;
• Most UARs occurred between July and October and early in the morning, when humidity was higher than normal;
• Most UARs occurred at sites with low pollution levels;
• Intensity of UARs was highest on composite insulator sets.
The possible reasons for these UARs therefore included:
• Pollution flashover
• Bird streamer induced flashover
• Unknown flashover mechanism
1. Pollution Flashover
Supporting the conclusion of pollution flashover as the underlying cause of UARs was their occurrence when there is higher humidity and condensation. However, arguing strongly against this explanation were the following:
• UARs tend to occur in areas with low or medium pollution levels while all insulators sets in the Czech Republic are dimensioned for high pollution;
• UARs occur most often on composite insulator sets that generally have better performance under polluted conditions.
2. Bird Streamer Induced Flashovers
Two facts supporting this explanation were:
• Time of UAR occurrence (month and time of day) is typical for bird streamer induced flashovers;
• Traces of bird excrement have been found on some tower cross-arms.
However, the key point arguing against this as an explanation was that this type of flashover generally occurred on overhead lines with lower system voltages and in the presence of large bird species not typical of the Czech Republic.
3. Unknown Flashover Mechanism
Since flashovers occurred at higher relative humidity levels, it is possible that they are somehow linked to changes in electric field distribution. On the other hand, the majority of UARs have been linked to composite insulators that, in principle, should better resist this type of flashover.
Camera Inspection of Lines
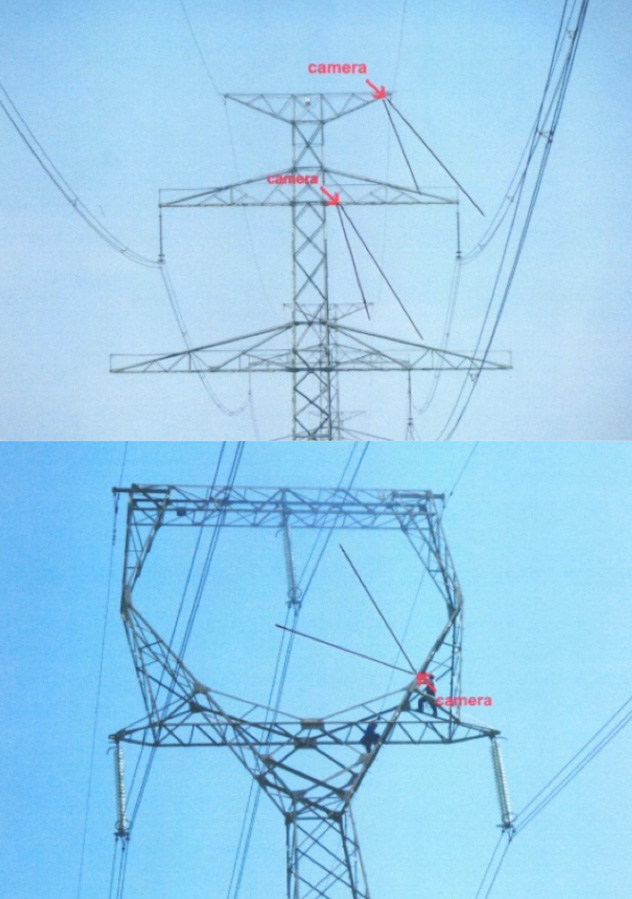
To gain more information, cameras triggered by movement sensors were installed on selected towers on two 400 kV lines passing areas with a relatively high occurrence of UARs. The insulator sets along one of the lines were composite type while the second was equipped with glass cap & pin strings. Monitoring was performed from June until October.
Inspection Results
Overhead Line with Composite Insulators
Two selected towers were monitored and about 1000 photos were taken by each camera over the period.
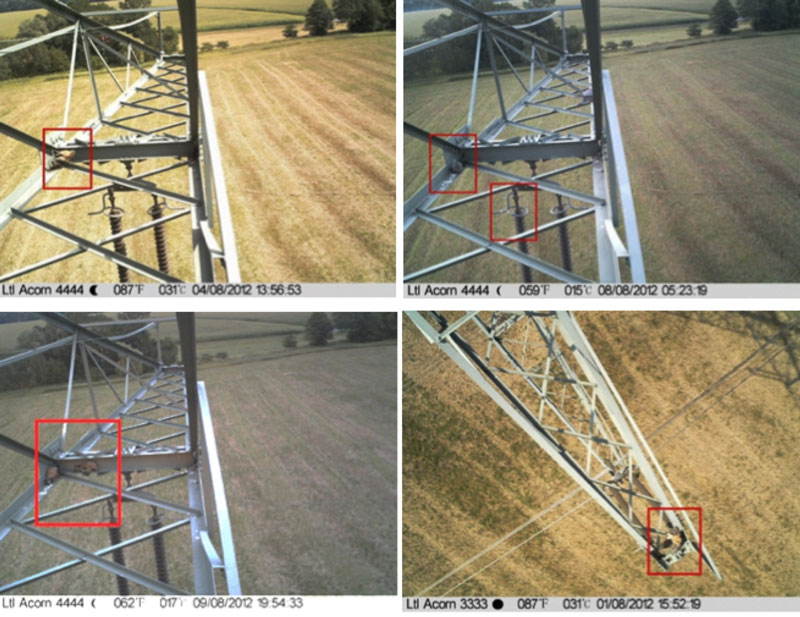
Presence on towers by one bird species, Eurasian Kestrel, was recorded. These birds seemed to have established a roosting site on tower elements close to the hanging points of insulator sets, as evidenced by leftover food and excrement.
Overhead Line Equipped with Glass Cap & Pin Insulators
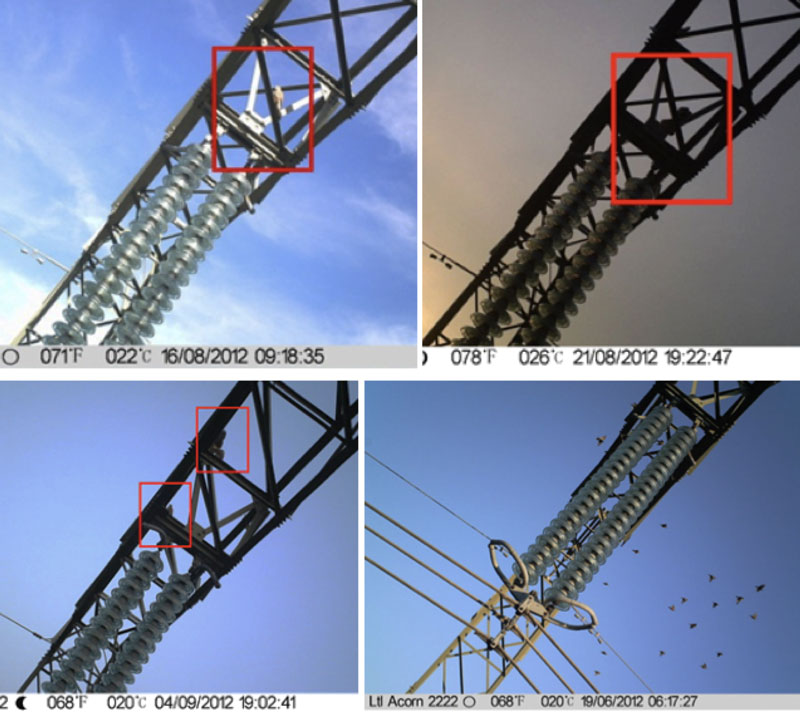
All UARs on this line were recorded on the upper phase (in the tower window), so the cameras on all three towers were directed here. During the period of monitoring about 300 photos were taken by each camera.
Conclusions from Camera Inspection
Overhead Lines with Composite Insulators
It seems probable that the main reason for UARs is bird streamer induced flashover. This conclusion was supported by presence of this species, traces of bird excrement on towers and the fact that insulator sets here have a relatively short arcing distance.
Overhead Lines with Glass Cap & Pin Insulators
On this line it was not possible to find a conclusive reason for the UARs, which were located only on the upper phase (inside the window) where recorded bird presence was low. At the same time, in one case what seemed to be power arc damage was observed on the conductor about 1m from the suspension clamp. This is typical for bird streamer induced flashover. Inspection of both lines then continued.
