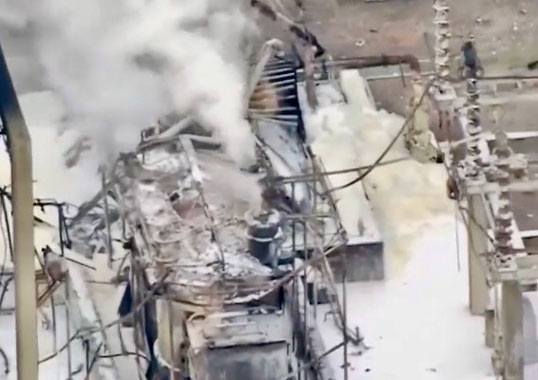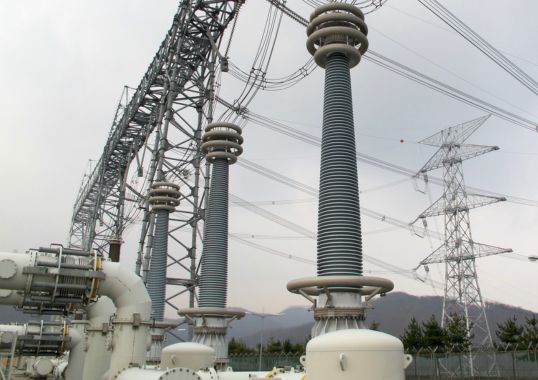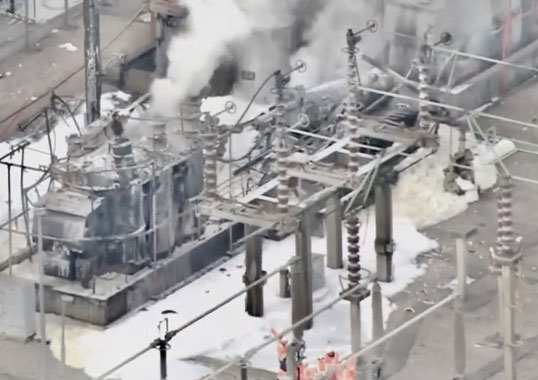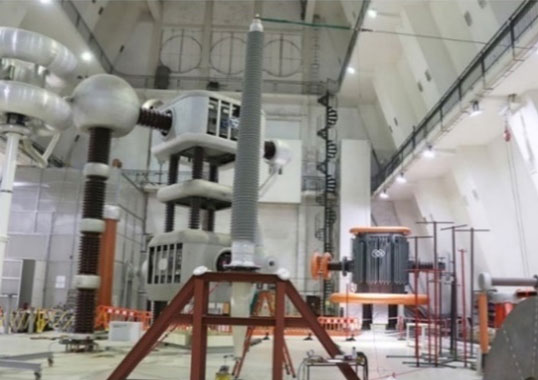
Capacitance graded bushings represent the main insulation components installed on transformers to connect safely and reliably to the grid. Mounted in contact with a transformer tank, these are normally immersed in the main insulation media on the lower part but exposed to ambient conditions on the upper part, including harsh environments, aggressive pollution and vandalism. Moreover, due to prescribed installation and operating conditions, transformer bushings are exposed to high electric field gradients, frequent thermal excursions, vibration and thermal as well as mechanical loads. They can also be involved in grid failure or events such as earthquake, windstorm and similar.
Design is crucial to their safe operation over the entire service life of transformers under all conditions. In this regard, different technologies have been developed for the condenser core to improve reliability and safety. Still, problems with bushings account for up to 50% of all of transformer failures. Consequences can be catastrophic, depending on bushing core technology, and this explains why qualification of technology and bushing test methodologies are crucial issues.
This edited contribution to INMR by Dr. Teresa Gargano and other experts at Hitachi Energy Technology Center in Switzerland reviews existing capacitance graded bushing technologies. The focus is on resin impregnated synthetics (RIS) applied to high voltage transformer bushings, together with the most advanced methodologies to assess technology and bushing reliability. Different tests of mechanical, thermal and electrical behavior are discussed as well, together with the limits of type test requirements in existing standards in covering all challenges related to performance of the synthetic material.
Overview of Condenser Core Technologies
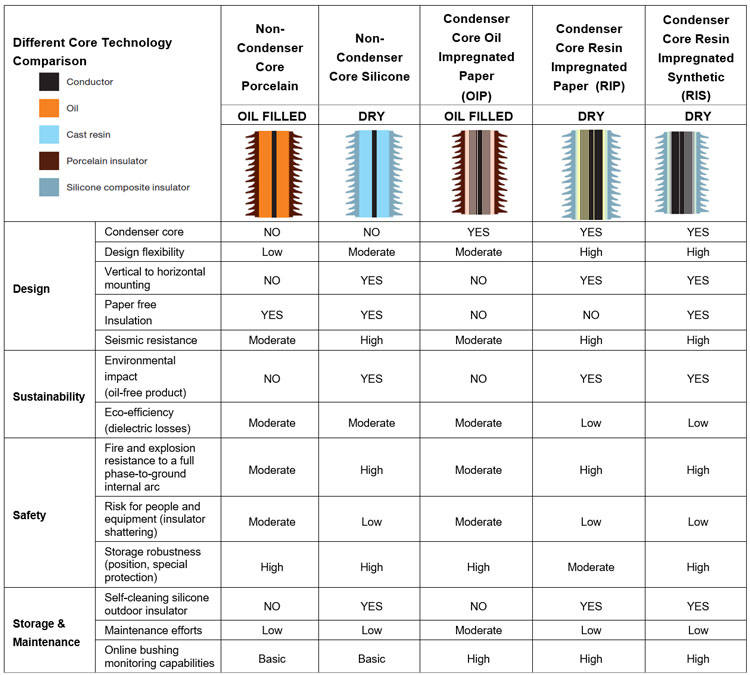
The following transformer bushing technologies presently dominate the global market:
• Oil impregnated paper (OIP) bushings (oil immersed technology for over 100 years);
• Resin impregnated paper (RIP) bushings (dry-type technology since the 1970s);
• Resin impregnated synthetic (RIS) bushings (paperless, dry-type technology since 2010).
Dry bushings offer a clear ‘Total Cost of Ownership’ (TCO) advantage compared to OIP styles:
• being fully dry and pressure-free;
• featuring a higher temperature class;
• being partial discharge free;
• having low dielectric losses;
• being fire resistant; and
• having outstanding mechanical properties.
The first paperless bushing technology was released in 2010. This relatively new technology brought added advantages compared to traditional RIP types due to replacement of the crepe paper with a synthetic material. For example, RIS types are characterized by lower dielectric loss factors (tanδ) – typically below 0.35% – and are less vulnerable to moisture ingress. This makes capacitance graded RIS transformer bushings ideal for the direct mold design, whereby there is no hollow composite insulator but rather the silicone housing is molded directly onto the core. While initial performance of RIS is comparable to that of state-of-the-art RIP bushings, RIS types are not vulnerable to risk of moisture ingress and associated increase in tanδ if improperly handled and stored. They therefore require less special care.
Similarly, it cannot be ruled out that high water content in aged transformer oil could penetrate an RIP bushing and adversely impact performance. RIS bushings are not affected by such risk during operation and this is another factor contributing to longer expected service life versus other technologies. Since RIS bushings can be stored without additional measures to keep humidity out, they can result in even lower life cycle costs than RIP styles. In this regard, they offer the promise of becoming the preferred choice for utilities whose key selection criterion for bushings is based on a long-term philosophy.
Over time, the range of RIS bushing offerings has evolved and voltage ratings increased to 245 kV and more recently to 550 kV – all in compliance with relevant IEC and IEEE standards. Moreover, the latest RIS bushings are void-free and allow partial discharge (PD) free operation up to twice maximum phase-ground operating voltage. This performance, equivalent to that of the state-of-the art RIP bushings, is significantly higher than the minimum required by IEC standards.
As with RIP types, the RIS core is the result of an impregnation process with epoxy resin. Epoxy resins have found application in this area in spite of the fact that their unique and superior properties carry somewhat higher cost. They are castable into rigid and strong three-dimensional structures. Impregnable as fluids in porous reinforcing structures, they convert through polymerization into a solid, which effectively fills all pores. These are properties that thermoplastic resins cannot offer. The dielectric constant and tanδ of epoxy resins varies with specific type of resin. Fig. 1, for example, compares typical variation of different epoxy resins in their 60Hz tanδ with increasing temperature.
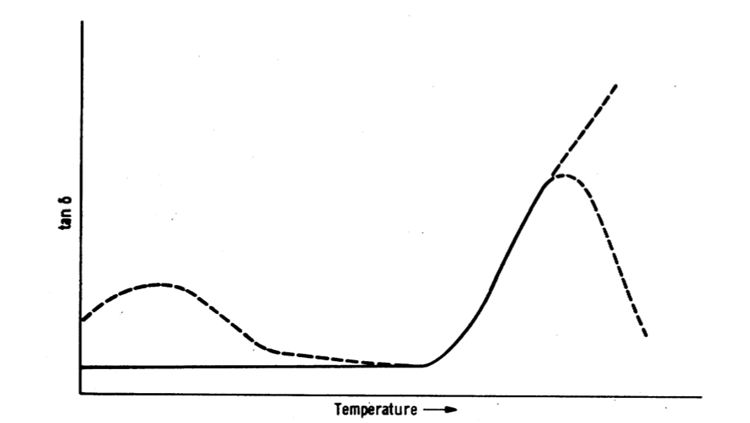
The point at which a high temperature increase begins often relates to a softening of the resin. Flexibilizing the resin shifts this peak toward lower temperatures while further curing of the resin (if insufficiently cured) shifts the peak toward higher temperatures. With proper attention to resin formulation, it becomes possible to achieve low tanδ at elevated temperatures.
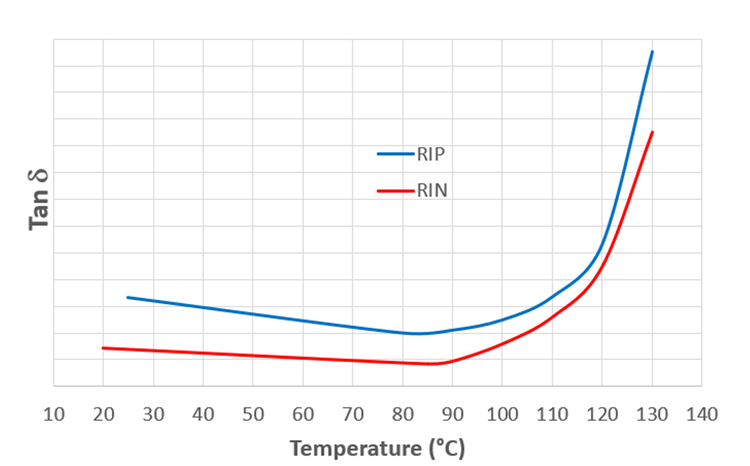
However, when epoxy resin is combined with paper, tanδ behavior of the composite material typically shows a curve that resembles the central part of that for pure epoxy (see Fig. 2). Tanδ of RIP bushings typically starts to rise from 80° and above. Given that operating conditions of bushings can be in the range of 100-110°C, how tanδ increases with temperature can seriously affect bushing performance. Tanδ is also influenced by presence of humidity, including any residual moisture still present in the core after the paper drying phase. In this regard, RIS technology allows for more stable tanδ, being that this technology assures almost no moisture absorption. Effects of different values of tanδ are further discussed below under thermal performance.

Special Tests to Qualify New Bushing Technology
Qualification of a new technology generally involves additional tests beyond the requirements found in international bushing standards. Standards therefore cannot provide guidance about the full set of tests needed to demonstrate performance. Rather, it is up to each manufacturer to establish appropriate test procedures. Such a qualification process involves different physics and consequently different special tests in addition to those performed on the final product.
A large number of tests were performed to qualify RIS technology, including:
• Test to verify thermal endurance properties of dielectric material;
• Full mechanical and thermal characterization (flexural test, tensile test, shear and toughness, thermal conductivity and thermal expansion tests);
• Limit tests on samples (AC and lightning impulse breakdown voltages) as well as limit tests on complete bushings;
• Loss factor measurement as a function of temperature;
• Lifetime test under voltage;
• Compatibility test;
• Thermal low-temperature cycle under mechanical load;
• Water and humidity absorption test;
• Painting adhesion test (in case of varnishing).
The methods and results of some of these tests are summarized below:
Thermal Class Index Definition
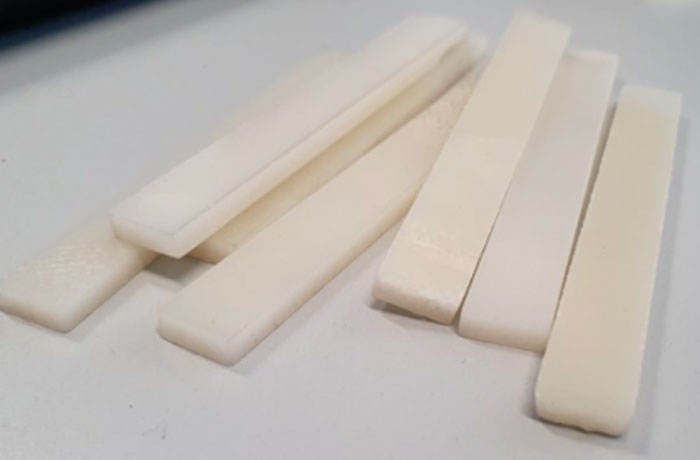
A long-term thermo-oxidation ageing test procedure was applied to reliably assess the thermal class of a dielectric insulating material such as RIS. Standard references for this method are found in IEC 60216-1 and ANSI UL-746B. The method consists in ageing groups of samples at different high temperatures and defining some property that will be measured and monitored – in this case flexural strength. The time until this property reaches a defined endpoint is then recorded for the grouped temperatures and this data used to infer the temperature compatible with lifetime operations. Flexural strength was monitored at 4 different temperatures, with a large number of samples (i.e. 200) prepared according to the applicable ISO standard (see Fig. 3). Total test duration was almost a year.
An increase in mass loss was observed at higher temperatures. This can be explained by evaporation of volatile or semi-volatile residuals present in the composite material, e.g. uncured monomers, light molecular weight synthesis products, etc. At higher temperatures, oxygen and humidity are catalysts for polymer degradation. Thermally driven depolymerization is a consequence of polymer chain scissions as well as spontaneous disorders in thermodynamic equilibrium. While this test gave indications on reliability in mechanical performance over time under elevated temperature, it offered no direct information on ageing under electric field stress. A separate special test arrangement was therefore designed to estimate lifetime under electrical field stresses typical of normal service conditions.
Lifetime Tests & Life Expectancy
The goal of lifetime and limit tests was to investigate breakdown strength of the new RIS technology under qualification and accordingly to define new design rules. The objective of a lifetime test is to determine the design field limit when a capacitance graded bushing is subjected to nominal voltage under service conditions, thereby guaranteeing desired lifetime expectation. To obtain acceptable test duration, the applied voltage had to produce an electrical radial gradient inside the condenser which is much higher than under typical service conditions. In post elaboration of test data, it became possible to extrapolate from the lifetimes tested (i.e. weeks and months), the design electrical radial gradients inside the condenser core when subjected to nominal voltage, so as to guarantee a design life expectancy of 30 or more years.
On the other hand, the most reliable method to define limiting field values is to measure the levels of the breakdown field in specially designed samples using a series of limit tests. The samples must be shaped so that the critical field occurs only at one single conductive layer. As such, the results can be interpolated to correlate breakdown voltage to time of voltage application as well as to specific geometric features such as distance between conductive layers and number of layers. The samples must reflect the actual design of a real bushing condenser core and, to achieve this, they are produced in similar sizes and go through the same normal bushing production process. Moreover, they also need to be from different production batches in order to take into account possible deviations between batches.
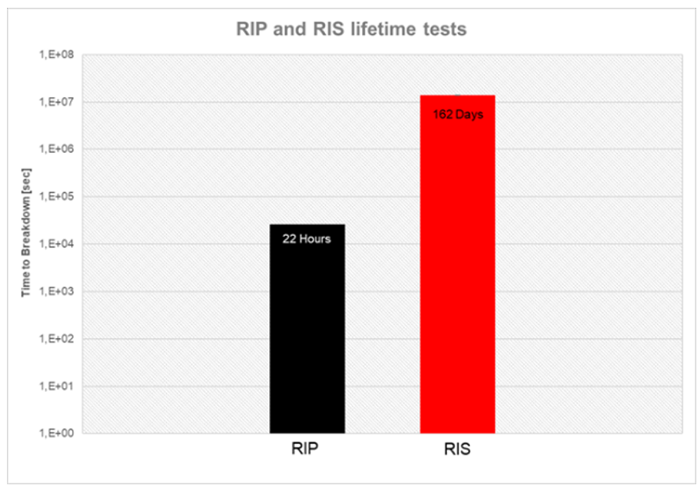
Performance of RIS samples under lifetime and limit tests was compared with data from proven RIP samples. Fig. 5 depicts comparative results in time to breakdown, with samples having the same geometry and manufactured according to both RIP and RIS technologies. The RIS samples subjected to this lifetime test did not fail over all the time available to conduct the test and were still without failure.
In spite of the fact that performance under limit test of the samples with the new technology was comparable to RIP, lifetime behavior of RIS samples is actually much better. This means a longer service life expectation when the condenser core is subjected to continuous service voltage. When comparing RIP and RIS technologies, tests results such as above must be correlated to the same geometry and service conditions.
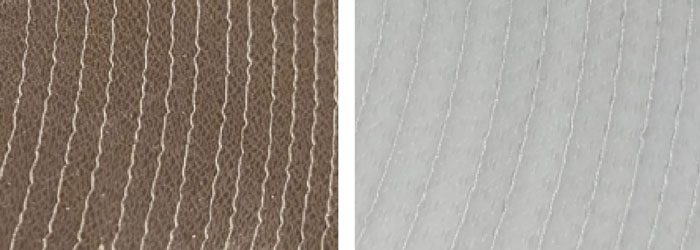
As evident from Fig. 6, the main contributor to better performance of paperless technology is the very smooth electric field distribution between conductive layers along the condenser core. This effect is generated thanks to the flatness of the synthetic material used which is different from RIP technology, where the crepe paper used maintains its intrinsic irregularities.
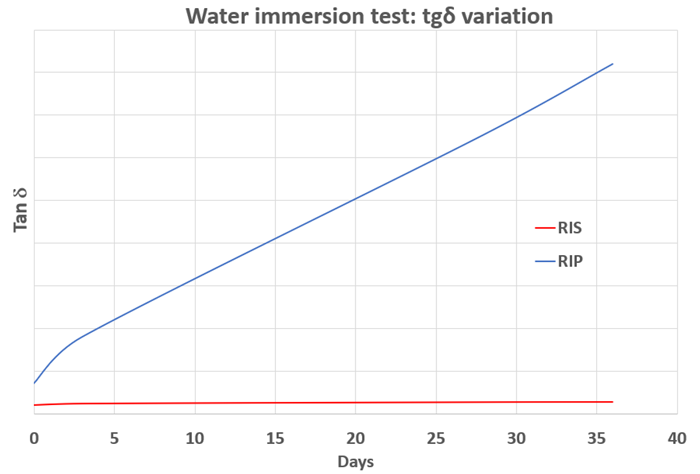
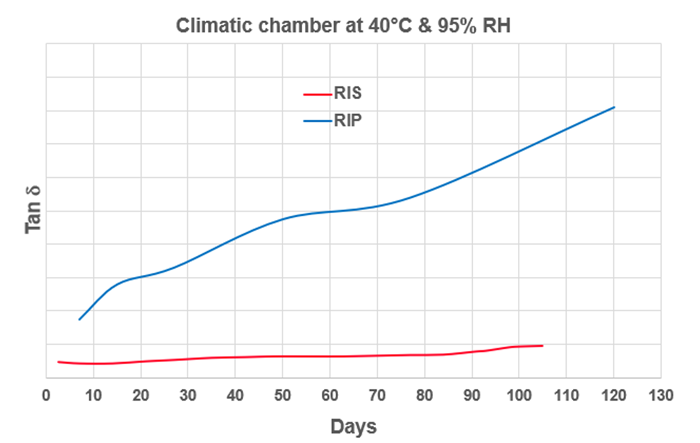
Water Immersion & Humidity Absorption Test
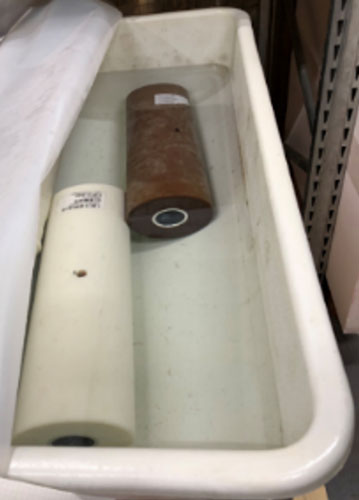
The purpose of these tests is to evaluate if any appreciable variation of tanδ (at 50Hz) can be measured, after immersing the complete naked condenser core under water with no special water treatment or adjustment in resistivity (see Fig. 7) or by placing it inside a climatic chamber with given temperature (40°C) and humidity (95% RH).
The tests are therefore useful to obtain a qualitative indication of humidity absorption rate of this technology over time, by means of tanδ measurements. Before starting this test, two samples with same geometry per test, one in RIS and the second in RIP, were produced and routine tested to obtain a reference value at room temperature. Those reference values were then used to determine humidity absorption rate of each individual sample over time.
Measurements were performed independently on each sample, at the same voltage and frequency. Figs. 8 and 9 qualitatively depict measurements of tanδ as a function of time. The extremely high level of hydrophobicity of RIS technology is clearly evident and this is much higher than for RIP, meaning high resistance to atmospheric moisture under all types of operating conditions.
RIS Bushing Thermal Performance
Analyzing RIP and RIS technologies, there are key similarities such as use of the same epoxy resin and process. Mechanical and thermal properties of the two bushing types are therefore similar, with the key difference being the media wound around the central tube of the condenser core.
The RIS dielectric, being paperless, is somewhat more resistant to the thermal exchanges from losses inside the condenser core. These are due to Joule losses generated inside the central conductor following passage of current and also from dielectric losses generated inside the condenser core, subject to high voltage.
Given the same geometry and rating, Joule losses are equal for RIP and RIS, since the central conductor and current are the same. By contrast, dielectric losses are lower in the RIS core because an RIS bushing at 20°C has a tanδ about 50-60% that of the RIP version. This tanδ is directly proportional to dielectric losses, according to the formula:
P=ω∙C∙V^2∙tgδ
This means that dielectric losses of RIS and RIP technologies are also in the same ratio.
Lower dielectric losses, together with the same Joule losses, equate to a lower heat flux from the internal core to the external part of the bushing and this compensates almost totally for the fact that the RIS dielectric is more resistant to heat exchange. As a result of such tests during qualification, the thermal margins of RIS bushings, there can be a large choice of different core diameters and conductor types that are able to absorb any small residual difference. In the end, this means the same ratings for both insulation technologies.
As discussed, the fact the RIS dielectric has a lower thermal conductivity with respect to RIP implies that, consistent with more difficult heat exchange, the time constant will also be larger. The time needed to reach the thermal steady state will therefore be considerably longer. If this poses a drawback during thermal testing (that needs more time to carry out), it can be an advantage in case of overload when a higher current (obviously still within the bushing’s rating), will generate more heat to be dissipated. The lower rate at which the condenser core increases its temperature will give it a lower ‘over-temperature’ profile with respect to RIP technology. This will allow a greater margin in terms of time during thermal transients with respect to the dielectric thermal limit, which is the same of that of RIP (i.e. 120°C).
Thermal Stability with Focus on RIS Technology
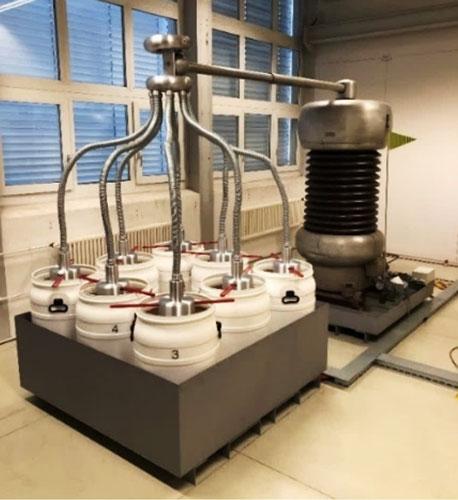
An interesting aspect of the two dry bushing technologies relates to thermal tests, especially the thermal stability test prescribed by IEC 60137 for dry AC bushings having Um>300 kV. The test is carried out on partially immersed bushings, i.e. transformer bushings where the bushing’s ‘tail’ is immersed in transformer fluid and complying to the following:
• Bushing’s tail is immersed in a tank filled with oil kept at 90°C ± 2°C;
• Joule losses, generated in the central conductor by passage of current, are simulated by inserting a dummy burden in the central tube, composed of a series of resistors (or a resistive wire) supplied by a set of batteries;
• Dielectric losses are generated by applying to the bushing a voltage of 0.8Um for bushings with Um>170 kV (meaning about 140% with respect to service voltage) and of Um for bushings having Um≤170 kV (meaning 170% of normal phase voltage). As indicated by the above formula, dielectric losses are proportional to the square of applied voltage. That means having losses of 1.9 and 3 times respectively versus those present under normal service conditions.
The scope of this test is to verify that, during service, losses generated by current passage in the condenser core will not trigger what is referred to as ‘thermal runaway’: losses will increase core temperature and consequently tanδ, which becomes higher with temperature, further increasing losses. At the same time, Joule losses will increase, given that the conductor becomes hotter. This will further step-up temperature in a chain-like phenomenon until such time that the bushing will become so hot that it will lose its dielectric withstand and move toward catastrophic failure. The acceptance criteria for this test are that any tanδ increase is no more than 0.0002 over a period of 5h and that repetition of the routine dielectric tests, once the bushing cools down, will show no variation in electrical parameters.
The first criterion, i.e. a variation lower than 0.0002 over a period of 5h, could not itself be sufficient to guarantee that the bushing will not go into thermal runaway. Given the fact that the thermal constant of this type of bushing is rather large (in the range of 8-12h for the biggest units), the time needed to reach a thermal steady state is much longer than the 5h of measurement as prescribed in the Standard. The object can be considered close to the thermal state after at least 4 time constants, meaning 32-48h.
Of course, it could happen that in 5h the tanδ variation is small and within the limits of the Standard. But the bushing is at the first part of the thermal heating curve, where temperature will continue to increase linearly for many hours with the risk that possible thermal runaway may not be detected during the test. Fig. 11, taken from a real case of testing a 550 kV RIS bushing, shows this behavior: the red curve is the measured tanδ variation over 7h, longer than the 5h requested by the IEC Standard.
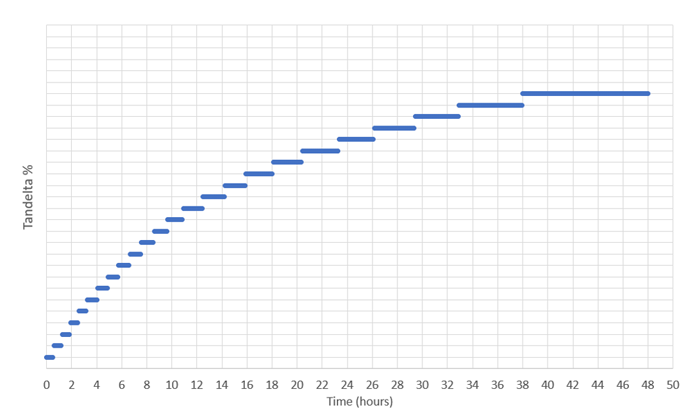
The tanδ variation over this time slot was less than half the maximum allowed according to the IEC standard. However the curve was quasi linear over that time frame and that behavior, if maintained continuously, can trigger thermal runaway. For this reason, the test was repeated by keeping the bushing under test for 48h. In this case it is clearly visible that the final condition will be a thermal steady state and not thermal runaway given that the heating curve is close to the asymptotic value.
To speed-up the test, the bushing was heated to its first-phase thermal steady state with simulated conductor losses for a couple of days and thermal status monitored. Moreover, tanδ measurement was taken for 1h at the end of the heating phase at a voltage of some kV (the minimum necessary to have a reliable tanδ measurement while avoiding generating appreciable losses in the condenser core that would further modify temperature). These measurements demonstrated that the thermal steady state was reached before applying voltage. At that moment, high voltage (0.8 Um) was applied and tanδ measured continuously for two days (48h), as shown in Fig. 12.
It was thus demonstrated that the bushing reached thermal equilibrium without going into thermal runaway. As a final comment, it can be said that the acceptance criterion presently given by the IEC 60137 no longer perfectly matches real thermal behavior of large dry bushings using RIS technology. Rather, it should be modified, at least in terms of duration (i.e. up to the point where it is clearly visible that the heating curve is asymptotic), in any future revision to this Standard.

Mechanical Tests
To verify the mechanical integrity of RIS bushings, cantilever simulations and tests were performed. The RIS bushings tested fulfilled and exceeded the minimum cantilever load requirements as per IEC 60137 and IEEE Std C57.19.01. For example, all EasyDry® (RIS) bushings subjected to the type tests passed the mechanical test carried out on their air side (see Fig. 13) and when applicable on the oil side (according to the IEEE Standard) with no evidence of damage or leakage and with positive repetition of routine tests. Any deformation measured at the bottom end was negligible.
Seismic Qualification of RIS Bushings
As mentioned, RIS bushings fulfill and exceed the requirements defined in the IEC and IEEE standards in terms of static load. Depending on geographic application of such bushings on a transformer, one of the major challenges is fulfilling the seismic requirement. A seismic event, which by nature is stochastic in strength and occurrence, can damage a bushing from interruption of operation to a disaster. It is therefore clearly in the interest of the end user to avoid or minimize such risk. The focus below is on presenting a method to ensure mechanical integrity of dry paperless RIS capacitance graded bushings under seismic events.
Currently, IEC and IEEE standards define many verified methods and qualification procedures. In addition, state-of-art finite element software tools are available to perform seismic analysis using a 3D finite element model of a bushing. For example, in the case of the EasyDry® (RIS bushing) portfolio, comprehensive experimental shaker table tests were carried out to validate the FE-Calculation results performed using Ansys software.
Numerical Analysis for Seismic Qualification
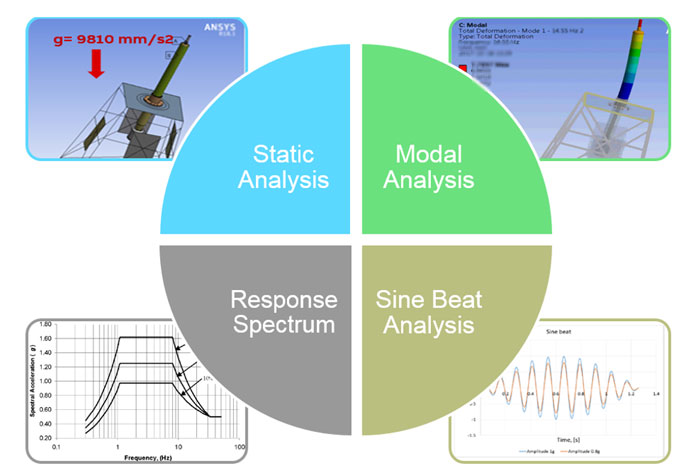
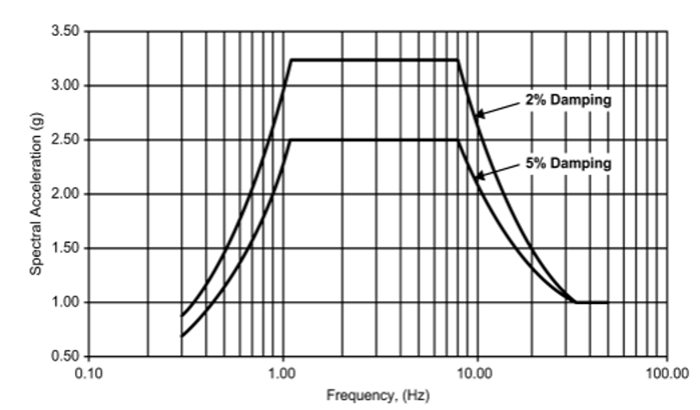
Among the different methods of seismic qualification, the response spectrum method for high seismic levels was conducted for RIS bushings. This analysis was performed using a procedure including static analysis, pre-stressed modal analysis, sine beat analysis (if requested) and response spectrum analysis (see Fig. 14). The frame is considered fixed at the base, where the excitation signal is applied. Conservatively, the response spectrum with 2% damping is shown in Fig. 15.
The input spectrum is applied simultaneously in three directions: 100% in horizontal and 80% in vertical. The spectral acceleration is then multiplied by an amplification factor of 2. In addition, conductor loading effects are also considered.
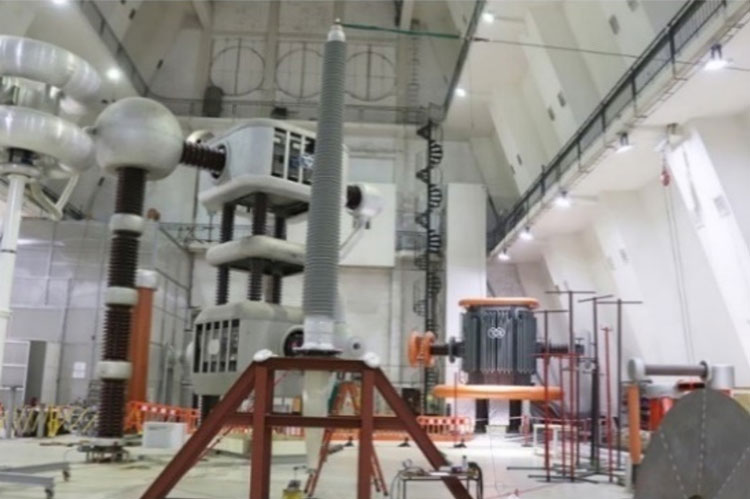
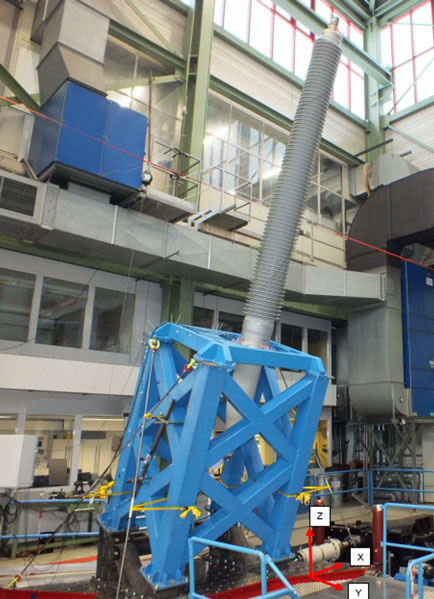
Based on analysis of results and later confirmed by a seismic test on a shake table, the 550 kV EasyDry® (RIS) bushing shown in Fig. 16 met or exceeded the requirements given in IEEE 693.
Moreover, using this same type of testing, the mechanical integrity under seismic load of Hitachi’s RIS and RIP bushings was verified by finite element analysis following the IEEE 693 and suitably confirmed by shake table tests. Generally, any major difference in performance is more linked to design aspects, e.g. whether a direct mold solution or a hollow composite insulator type. Actually, it was shown that design of the flange and presence of a composite fiberglass tube in the insulator are key design features governing performance under seismic applications and not the basic bushing insulation technology itself.
Given the choice among certain bushing components, it cannot be generalized which bushing technology is more suitable for seismic applications. Generally, the design feature that make for any difference in performance could be transferred from RIP to RIS and vice-versa. There is no basic difference between RIP and RIS bushing technologies in regard to seismic loading.

Conclusions
Capacitance graded transformer bushing design is crucial to enable safe operation of transformers under all types of service conditions all through the service life. Qualification of technology and testing methodologies are therefore fundamental to sustain reliability and safety of transmission. This article presented existing capacitance graded bushing technologies with special focus on resin impregnated synthetics (RIS) applied to high voltage transformer bushings, together with the most advanced methodologies to assess technology and bushing reliability. Different tests of mechanical, thermal and electrical behavior were discussed, together with the limits of type test requirements in present technical standards so as to cover all the challenges related to specific performance of synthetic materials in bushings.
References
[1] P. V. Goosen, “Transformers accessories”, Cigrè 1996 – Paris session, paper 12-104.
[2] A. Dais, T. Schütte, J. Czyzewski, “Increasing Transformer Reliability by Proactive Bushing Fleet Management”, INMR world congress, 2015.
[3] Hitachi Energy, Transformer bushings product guide, 2023.
[4] Cigrè brochure 755 – Bushing reliability.
[5] IEC 60137 Ed. 7, 2017, “Insulated bushings for alternating voltages above 1000 V”.
[6] A. Petersen, “The Risk of Transformer Fires and Strategies Which Can be Applied to Reduce the Risk”, CIGRE, 2010.
[7] IEC TS 61463-2016, “IEC Technical Specification, Bushings – Seismic Qualification”, 2016.
[8] IEEE Std 693™-2018, “IEEE Recommended Practice for Seismic Design of Substations”.
[9] IEEE Std™ C57.19.01-2017, “Performance Characteristics and Dimensions for Outdoor Apparatus Bushings”.
[10] ANSYS Inc., “Ansys Mechanical User`s Guide”, 2023.
[11] IEC 60068-2-57-2013, “Environmental testing-Part 2-57: Tests – Test Ff: Vibration – Time-History and Sine-Beat Method”.
[12] U. Krüsi, A. Dais, J. Czyzewski, “New paper-free insulation technology for dry high-voltage condenser bushings” – CIRED 2013 – paper 0791.
[13] T.W. Dakin, “Application of epoxy resins in electrical apparatus”, IEEE Transactions on Electrical Insulation, Volume: EI-9, Issue: 4, December 1974.
[14] IEC 60216-1-2013, “Electrical insulating materials – Thermal endurance properties – Part 1: Ageing procedures and evaluation of test results”.
[15] ANSI UL 746B-2013, “Polymeric materials – Long term property evaluations”.
[16] IEC 60216-1, 2013, “Electrical insulating materials – Thermal endurance properties – Part 1: Ageing procedures and evaluation of test results”.
[17] C57.19.00-2004 – “IEEE Standard General Requirements and Test Procedure for Power Apparatus Bushings”.
[18] J. Rocks, EasyDry®: A new paradigm for transformer bushings, Transformer magazine, Vol. 10, 3, 2023.