Background on 132 kV Kuala Krai-Gua Musang (KKRI-GMSG) Line
This 113 km double circuit line was commissioned in 1995 and consists of 295 towers. Between 2001 and 2012, it recorded a total of 53 trippings, most of the double circuit type. This translates into a tripping rate of 4.26/100 km-year – considered unacceptably high when compared to TNB’s average for such lines of 1.8/100 km-yr. Acceptable tripping rates for 132 kV lines at most other utilities are reportedly between 1.5 and 2.8/100 km-yr.
A study was therefore undertaken with the goal of explaining the seeming ‘ineffectiveness’ of more than 120 line arresters (TLAs) installed on this line between 2007 and 2012. In theory, an increasing population of TLAs should have reduced line flashover rate. Yet, for this line, flashover rate increased.
Background on 500 kV Ayer Tawar-Bukit Tarek (ATWR-BTRK) Line
The 145 km 500 kV ATWR-BTRK line consists of 352 towers and in recent years experienced trippings at a rate of 1.532/100 km-year. This rate was also considered too high, as an acceptable rate in the case of such important lines should be less than 1/100 km-year.
In both cases, it was regarded as necessary to analyze historical line performance in order to find the best way to reduce nominal tripping rates to more acceptable levels.
Geographic Profiles of Lines
The 132 kV KKRI-GMSG line is located in a ‘mixed area’ comprising the town of Kuala Krai, flat land and dense jungle around Gua Musang. A total of 154 towers (52%) are located in flat areas while 139 towers (47%) are in jungle. The remaining two towers are near substations. In the case of the 500 kV ATWR-BTRK line, 40% of towers are located in hilly areas (i.e. at higher altitudes).
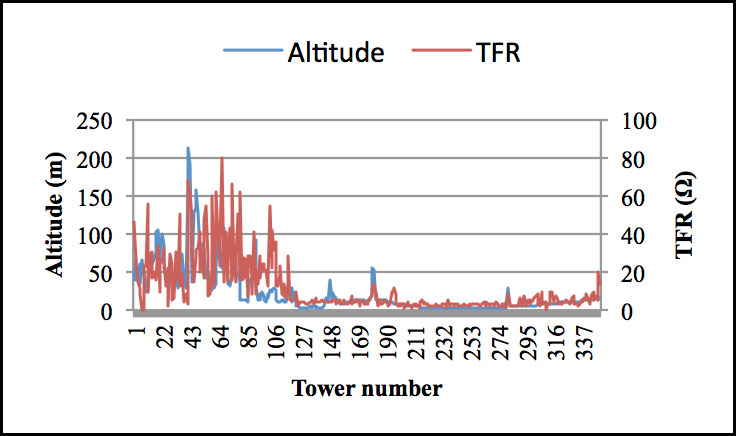
To better understand soil conditions along the two lines, tower footing resistance (TFR) values were determined for both. Figs. 2 and 3 are charts showing altitude and TFRs for the different tower locations along each.
As evident from Fig. 2, TFR for the 132 kV line is typically higher at lower altitudes and vice versa.
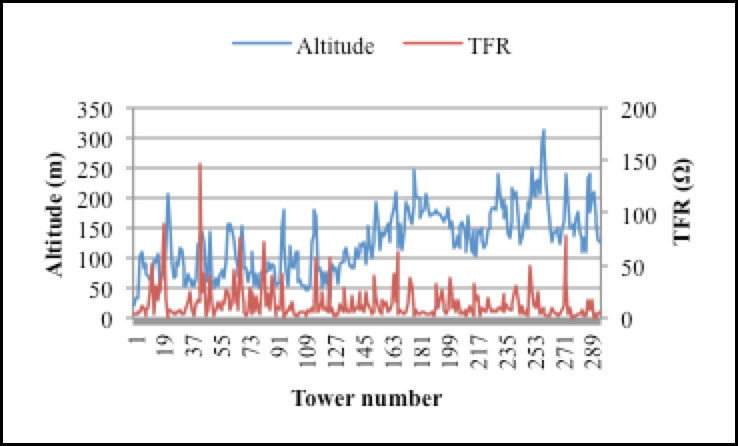
Fig. 3 shows that TFR values for the 500 kV line increase in higher altitude areas. This usually means very poor lightning performance since the line becomes the main target for lightning.
Ground Flash Density
Another important factor considered in reviewing past performance was historical data on lightning activity along the two lines. Ground flash density for both is presented in Figs. 4 & 5 although, due to limited availability of data from the lightning detection system, only several years of information was available for comparison.
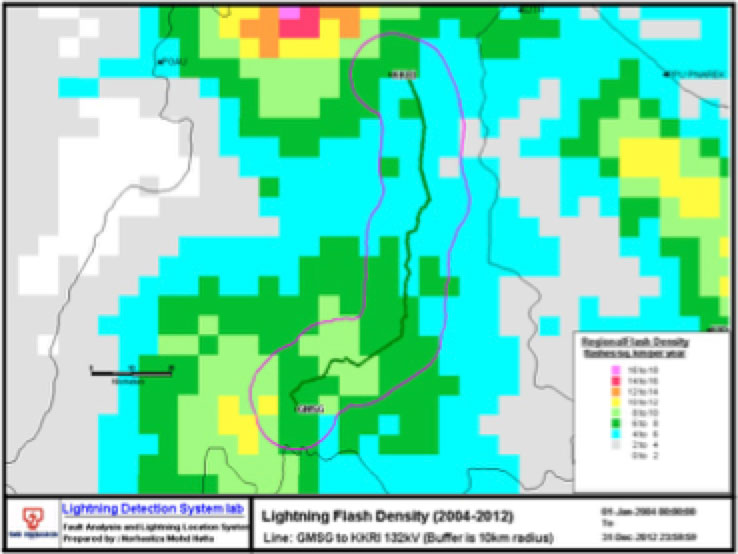
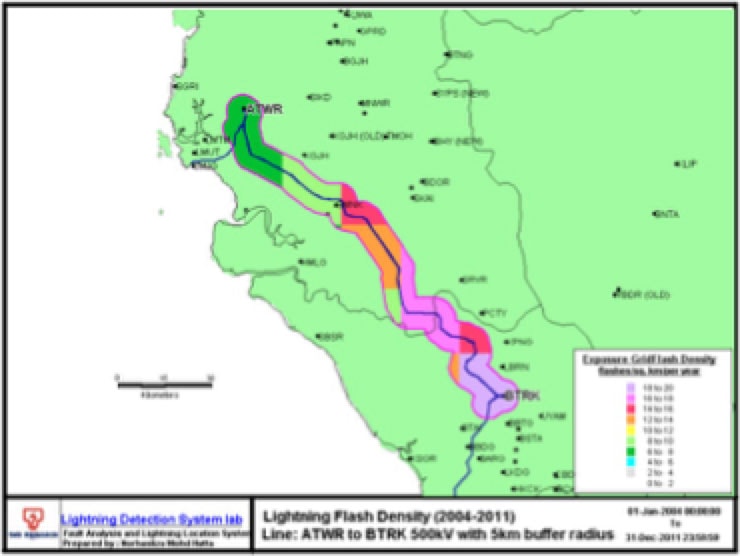
In the case of both lines, higher GFD was detected in areas with higher altitude (near GMSG for the 132 kV line and around BTRK for the 500 kV line. This only served to worsen lightning performance.
Tripping History
Due to high isokeraunic levels in Malaysia, lightning has always been the single major cause of trippings on overhead lines at both transmission and distribution voltages. Fig. 6 depicts the lightning flashovers recorded since 2001 that caused such lines to trip.
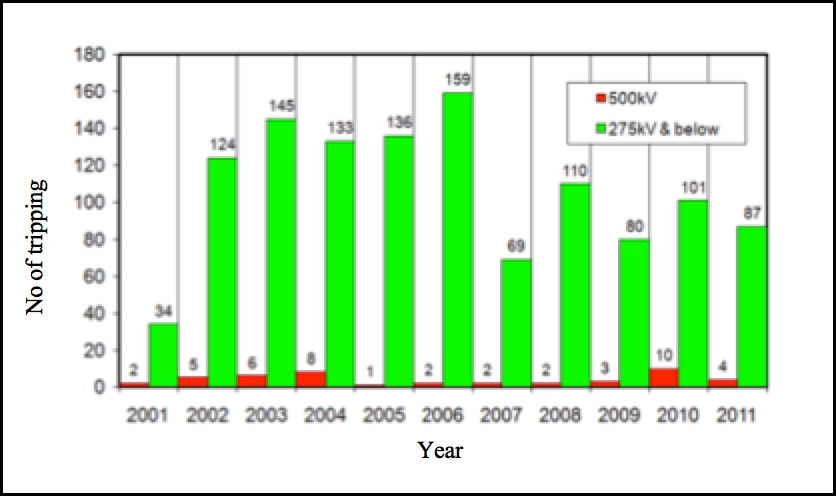
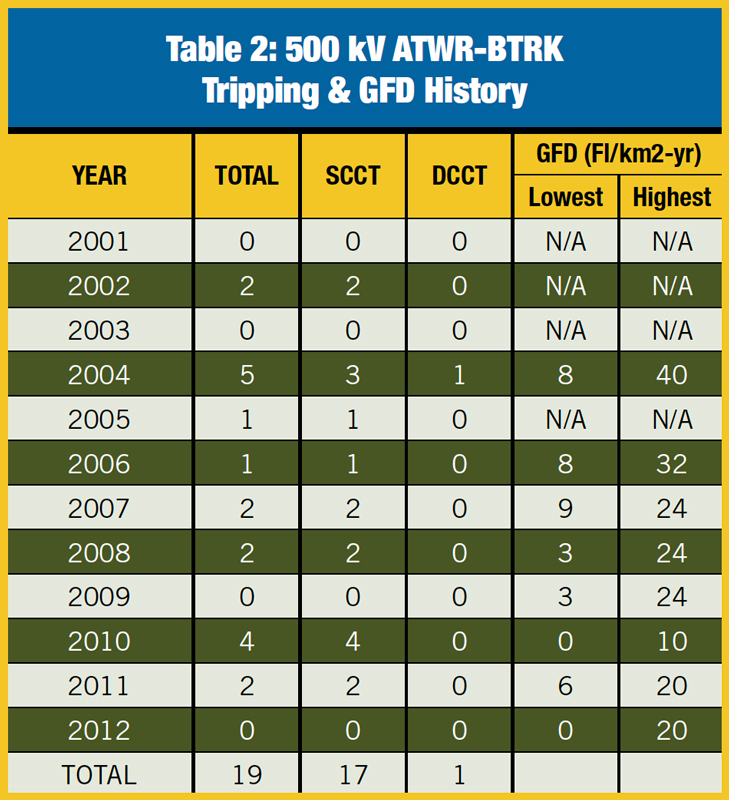
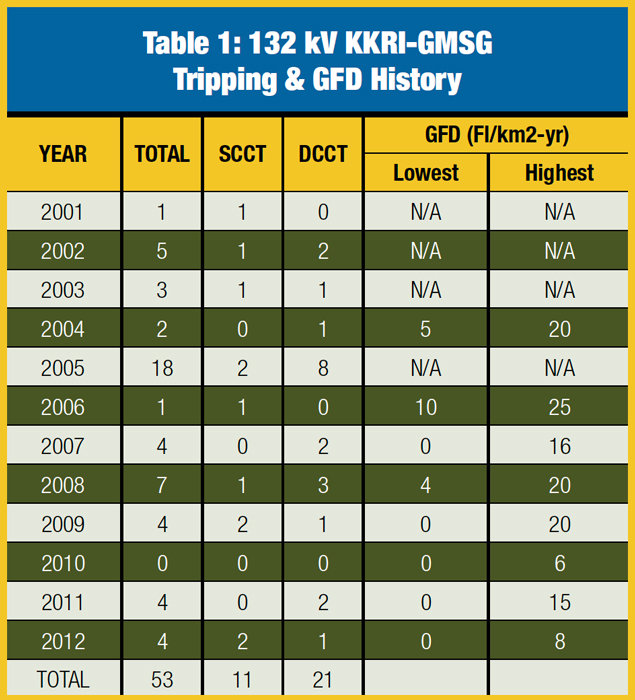
According to TNB’s Centralized Tripping Information System, yearly tripping occurrences since 2001 (both single and double circuit variety) as well as respective GFD values for the KKRI-GMSG and ATWR-BTRK lines are presented in Tables 1 and 2.
For the 500 kV ATWR-BTRK line, 19 tripping have been recorded since 2002 which included a double circuit tripping (DCCT) in 2004. It can also be seen that 8 trippings occurred on Circuit 1 while 11 were on Circuit 2. This results in a tripping rate of 1.532/100 km-year, which is unacceptably high compared to TNB’s overall average of 0.9/100 km-year.
In 2012, total tripping rate on the 500 kV line was reduced to zero (even though GFD value remained high) because of a major tower footing resistance job exercise carried out along its entire route. Moreover, because of a special fault location system installed at the time, it became possible to determine the exact site of every line trip (see Fig. 7).

Simulations
In conducting insulation coordination studies, it was decided that TFlash software would be used for the 132 kV line and others where there were no special requirements. For the 500 kV line, however, TFlash, SIGMA SLP, PSCADD and EMTP software were selected to best aid in such areas as selecting which towers were the best to install the TLAs, which would be the proper phase(s) for each such installation as well as required arrester energy handling. In the case of both lines, only externally gapped line arresters (EGLAs) were specified due to their perceived advantages from the perspective of TNB’s network and service environment.
132 kV KKRI-GMSG Line
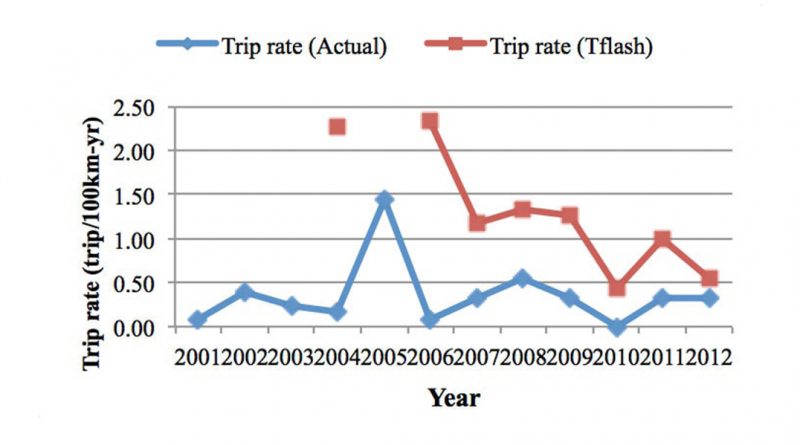
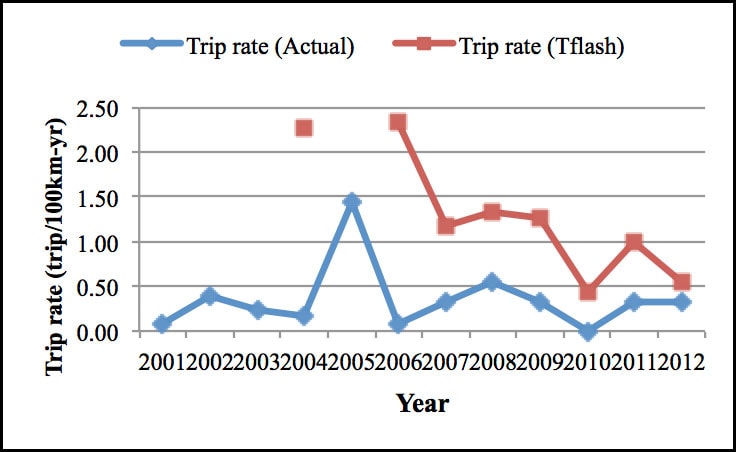
Using TFlash software, line performance was compared both before and after installation of EGLAs. Results from the overall 11-year service performance study are shown in Fig. 8.
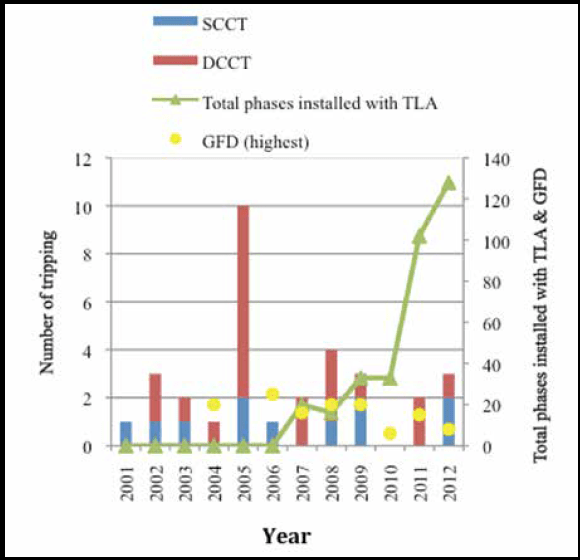
It is clear that, with increasing GFD value, total trip rate of the line increases although there was no data for comparison purposes for 2001-2003 and 2005.
Figure 8 also shows that, in spite of a growing population of TLAs installed throughout the line, there was no accompanying reduction in tripping rate. This result was unexpected, as more TLAs should have reduced total trip rate and improved line performance.
TFlash simulation was also carried out on performance each year i.e. with changing yearly GFD values. Results showed a similar pattern and correlated with actual data, which means that the simulation was close to the real situation.
500 kV ATWR – BTRK Line
TNB had never before installed TLAs at 500 but this line was deemed an exception due to tripping occurrences that were regarded as unusually high and unacceptable. Moreover, it would normally have been preferred to improve tower footing resistance (TFR) before going with the TLA option due to the relatively high cost of such arresters as well as the difficulty in scheduling a temporary shutdown of such an important line for the purpose of their installation.
However, because this line had a history of high annual tripping, management decided in favor of EGLAs, but only for the most critical towers with extremely high TFR values. Therefore, different software was used to simulate the line and help in selecting the best tower locations with the goal of optimizing installation so as to best control costs.
a. EMTP Software
With help from an OEM, a simulation using EMTP software was conducted and the results are show in Table 3.
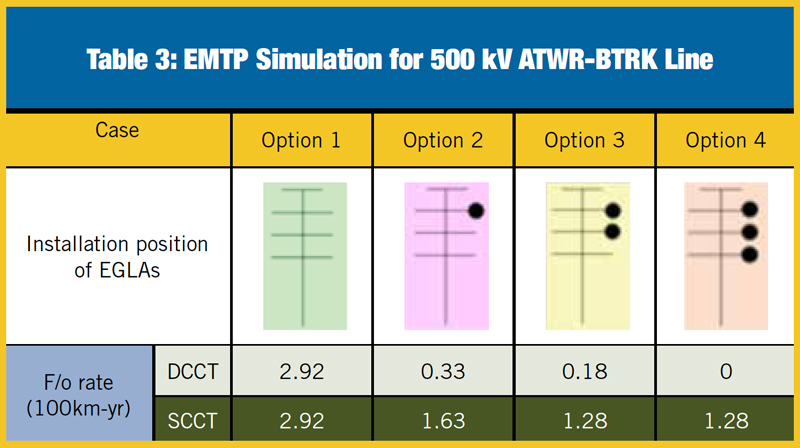
• Footing resistance = 2.2Ω;
• GFD = 20 flashes/km2-yr;
• EGLA installation rate for Options 2, 3 and 4 = 100% (all towers).
The best installation option involved installing TLAs on all phases of one circuit, which would result in zero DCCT trippings (even though some SCCT tripping would be unavoidable).
b. SIGMA SLP Software
Using SIGMA SLP, the line was divided into 7 sections, according to maximum GFD value, and results are presented in Table 4.
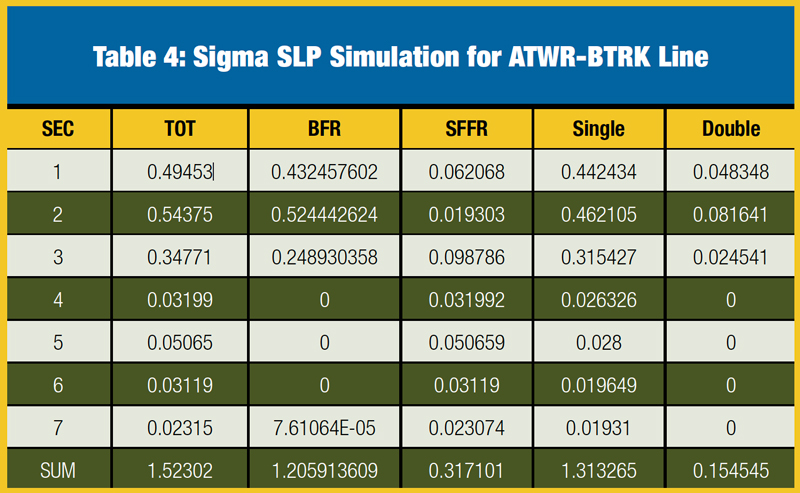 As can be seen from this simulation, Sections 1 to 3 of the line (i.e. closer to the GMSG area) are more likely to experience lightning flashovers compared to Sections 4 to 7. Therefore, installation of TLAs would ideally be focused in this area although information on which exact towers would still have to be determined using TFlash software. Simulations were also conducted to compare line performance when different phases are equipped with TLAs. The relative positions of TLAs for the four case studies are shown in Fig. 10.

Results showed that Case 4 resulted in the best overall line performance, followed by Cases 3 and 2.
c. TFlash Software
Seven case studies were conducted using TFlash software and involving different TFR values, different numbers of TLAs per tower, different installations on the phases, etc. However, the optimal configuration using this simulation was not selected due to cost constraints since achieving the target performance of 0.8Flsh/100 km-yr would require at least 330 TLAs installed on 150 towers.
This was seen as representing too large an investment and therefore it was decided to reduce the number of towers with installed TLAs through a process of prioritization. The TFR values, elevations and GFD records were studied for all 150 towers and, in each case, those whose TFR value was greater than 40Ω, elevation higher than 100 m (ASL) and GFD more than 16Fl/km²-yr were given a score. Towers receiving a total score of 3 would then be highlighted as having the highest risk of being struck by lightning. Based on this ranking process, only 4 towers along the 500 kV line were ultimately selected for installation of TLAs.
In addition, phase transposition towers were also studied and it was found, based on the TFlash simulation, that the outer phases would always have the highest chance of lightning strike. Therefore, 2 out of the 5 such towers on the line located in the region of greatest lightning activity were also selected for TLA installation.
Location of TLAs
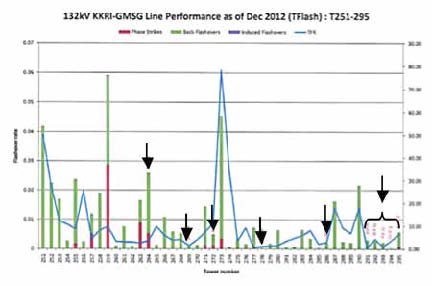
Results from the TFlash simulation for the 132 kV KKRI-GMSG line clearly showed that the locations of previously installed TLAs were not the towers with the highest probabilities of lightning strike. This was because there was no Insulation Coordination software available in 2006 to aid in the installation planning process. Moreover, TFR values used in previous studies were too low (below 10Ω) due to incorrect measurement methods and equipment. Examples of wrong TLA placements, for example, are shown in Fig. 11.
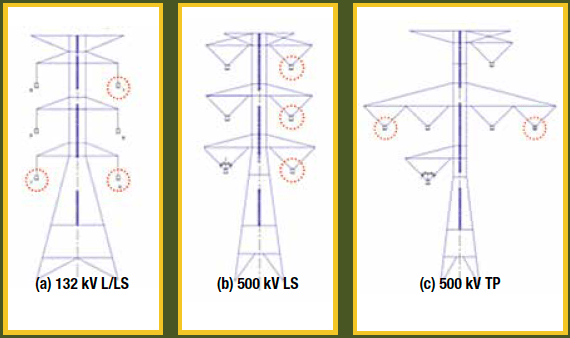
Upon completion of the study, the final TLA installation configuration for both the 132 kV and the 500 kV line are depicted in Fig. 12.
CLICK TO ENLARGE
Conclusions
In the case of the 132 kV KKRIGMSG line, it was concluded that:
1. the ineffectiveness of the EGLAs already installed on the line was due to their being improperly positioned due to earlier work that relied on incorrect TFR values;
2. historical GFD data had not been used to select the best tower locations on which to place EGLAs and installation was based rather on the location of lightning strikes during tripping. Since ground flash density (GFD) values affect line performance, increasing/decreasing GFDs from year to year either increased or decreased the line’s trip rates.
For the 500 kV ATWR-BTRK study the major findings were: 1. In 2012, overall tripping rate was reduced to zero in spite of a high GFD value due to a major TFR reduction job conducted throughout the line; 2. Installing TLAs on all 3 phases would prevent any double circuit tripping (DCCT);
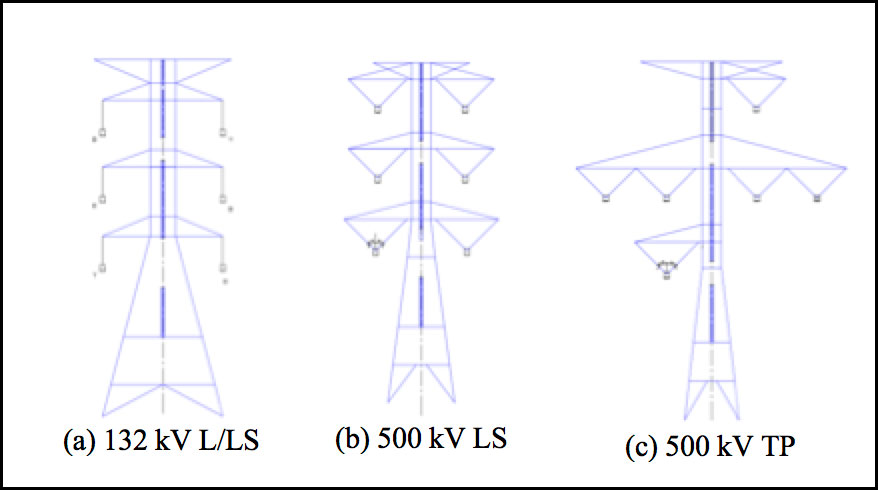
3. Installing TLAs in an L-shaped configuration would reduce the rate of back-flashovers (BFR);
4. Phase transposition towers are relatively more exposed to lightning strike due to positive protection angles.

