Statistics show that bushings are among the main contributors to transformer failure. Their failure therefore has huge impact on reliability as well as safety of the system and operators managing the asset. With this in mind, utilities in Southeast Asia embarked on a joint bushing reliability survey several years ago and jointly formulated mitigation measures to improve bushing performance.
The survey, discussed in this edited past contribution to INMR by engineers S. Gobi Kannan, Chitapon Jedwanna and Henny Ika, respectively at Tenaga Nasional Berhad (TNB) in Malaysia, the Electricity Generating Authority of Thailand (EGAT) and Perusahaan Listrik Negara (PLN) in Indonesia, summarized failure and root cause at each participating utility between 2001 and 2015. Different practices among members were discussed with a view to improving selection, specification, design, condition assessment, storage and handling of bushings. These changes were deemed necessary to have real impact on safety and performance of transformers and the grid as a whole.
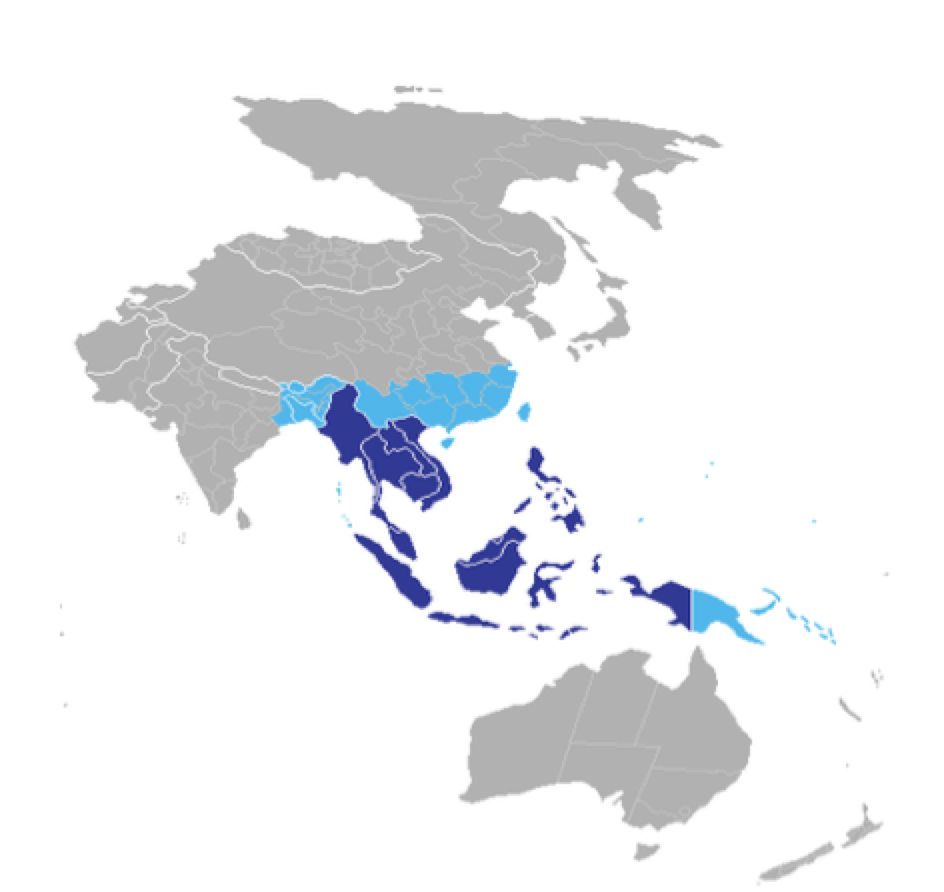
The ASEAN Utilities Maintenance Committee (JMCC) was formed in 2002 comprising 3 transmission utilities in the region, i.e. TNB Malaysia, PLN Indonesia and EGAT of Thailand. These member utilities supply approximately 60% of energy demand in the region based on the APEC Energy Demand and Supply Outlook. Their installed fleet as of several years ago consisted of over 3300 transformers up to 500 kV with total installed capacity of over 290,000 MVA. These networks included a total of about 100,000 circuit-km of overhead lines and cables.
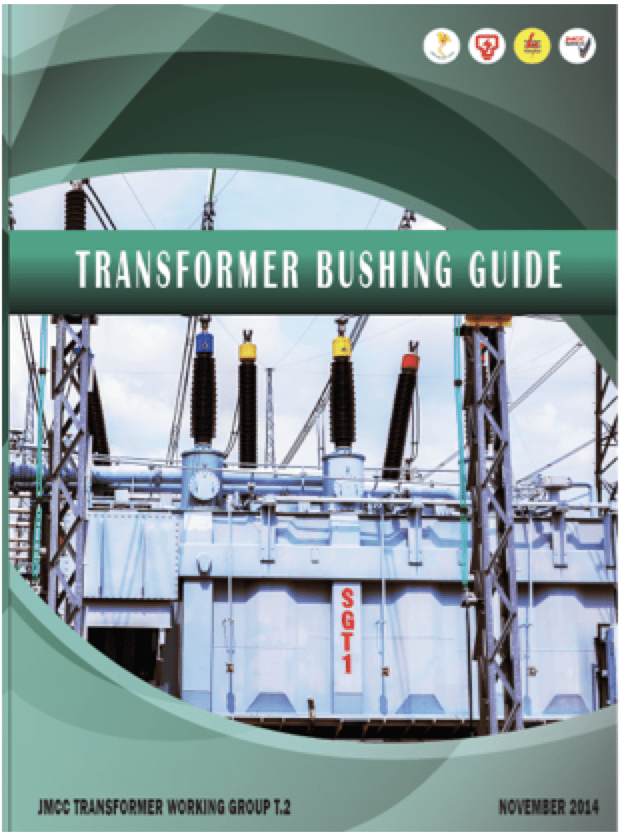
In recent years, failures of high voltage bushings have had significant impact on system reliability and safety and on operators managing the asset within this region. This has triggered the three major ASEAN utilities to embark on a joint bushing reliability survey study and to formulate mitigation measures to improve bushing performance. The outcome of this work was publication of the first ASEAN Transformer Bushing Guide T.2 (2015). The Guide contains a compilation of information on historical problems, lessons learned, best practices among members and risk mitigation measures.
Failure Statistics
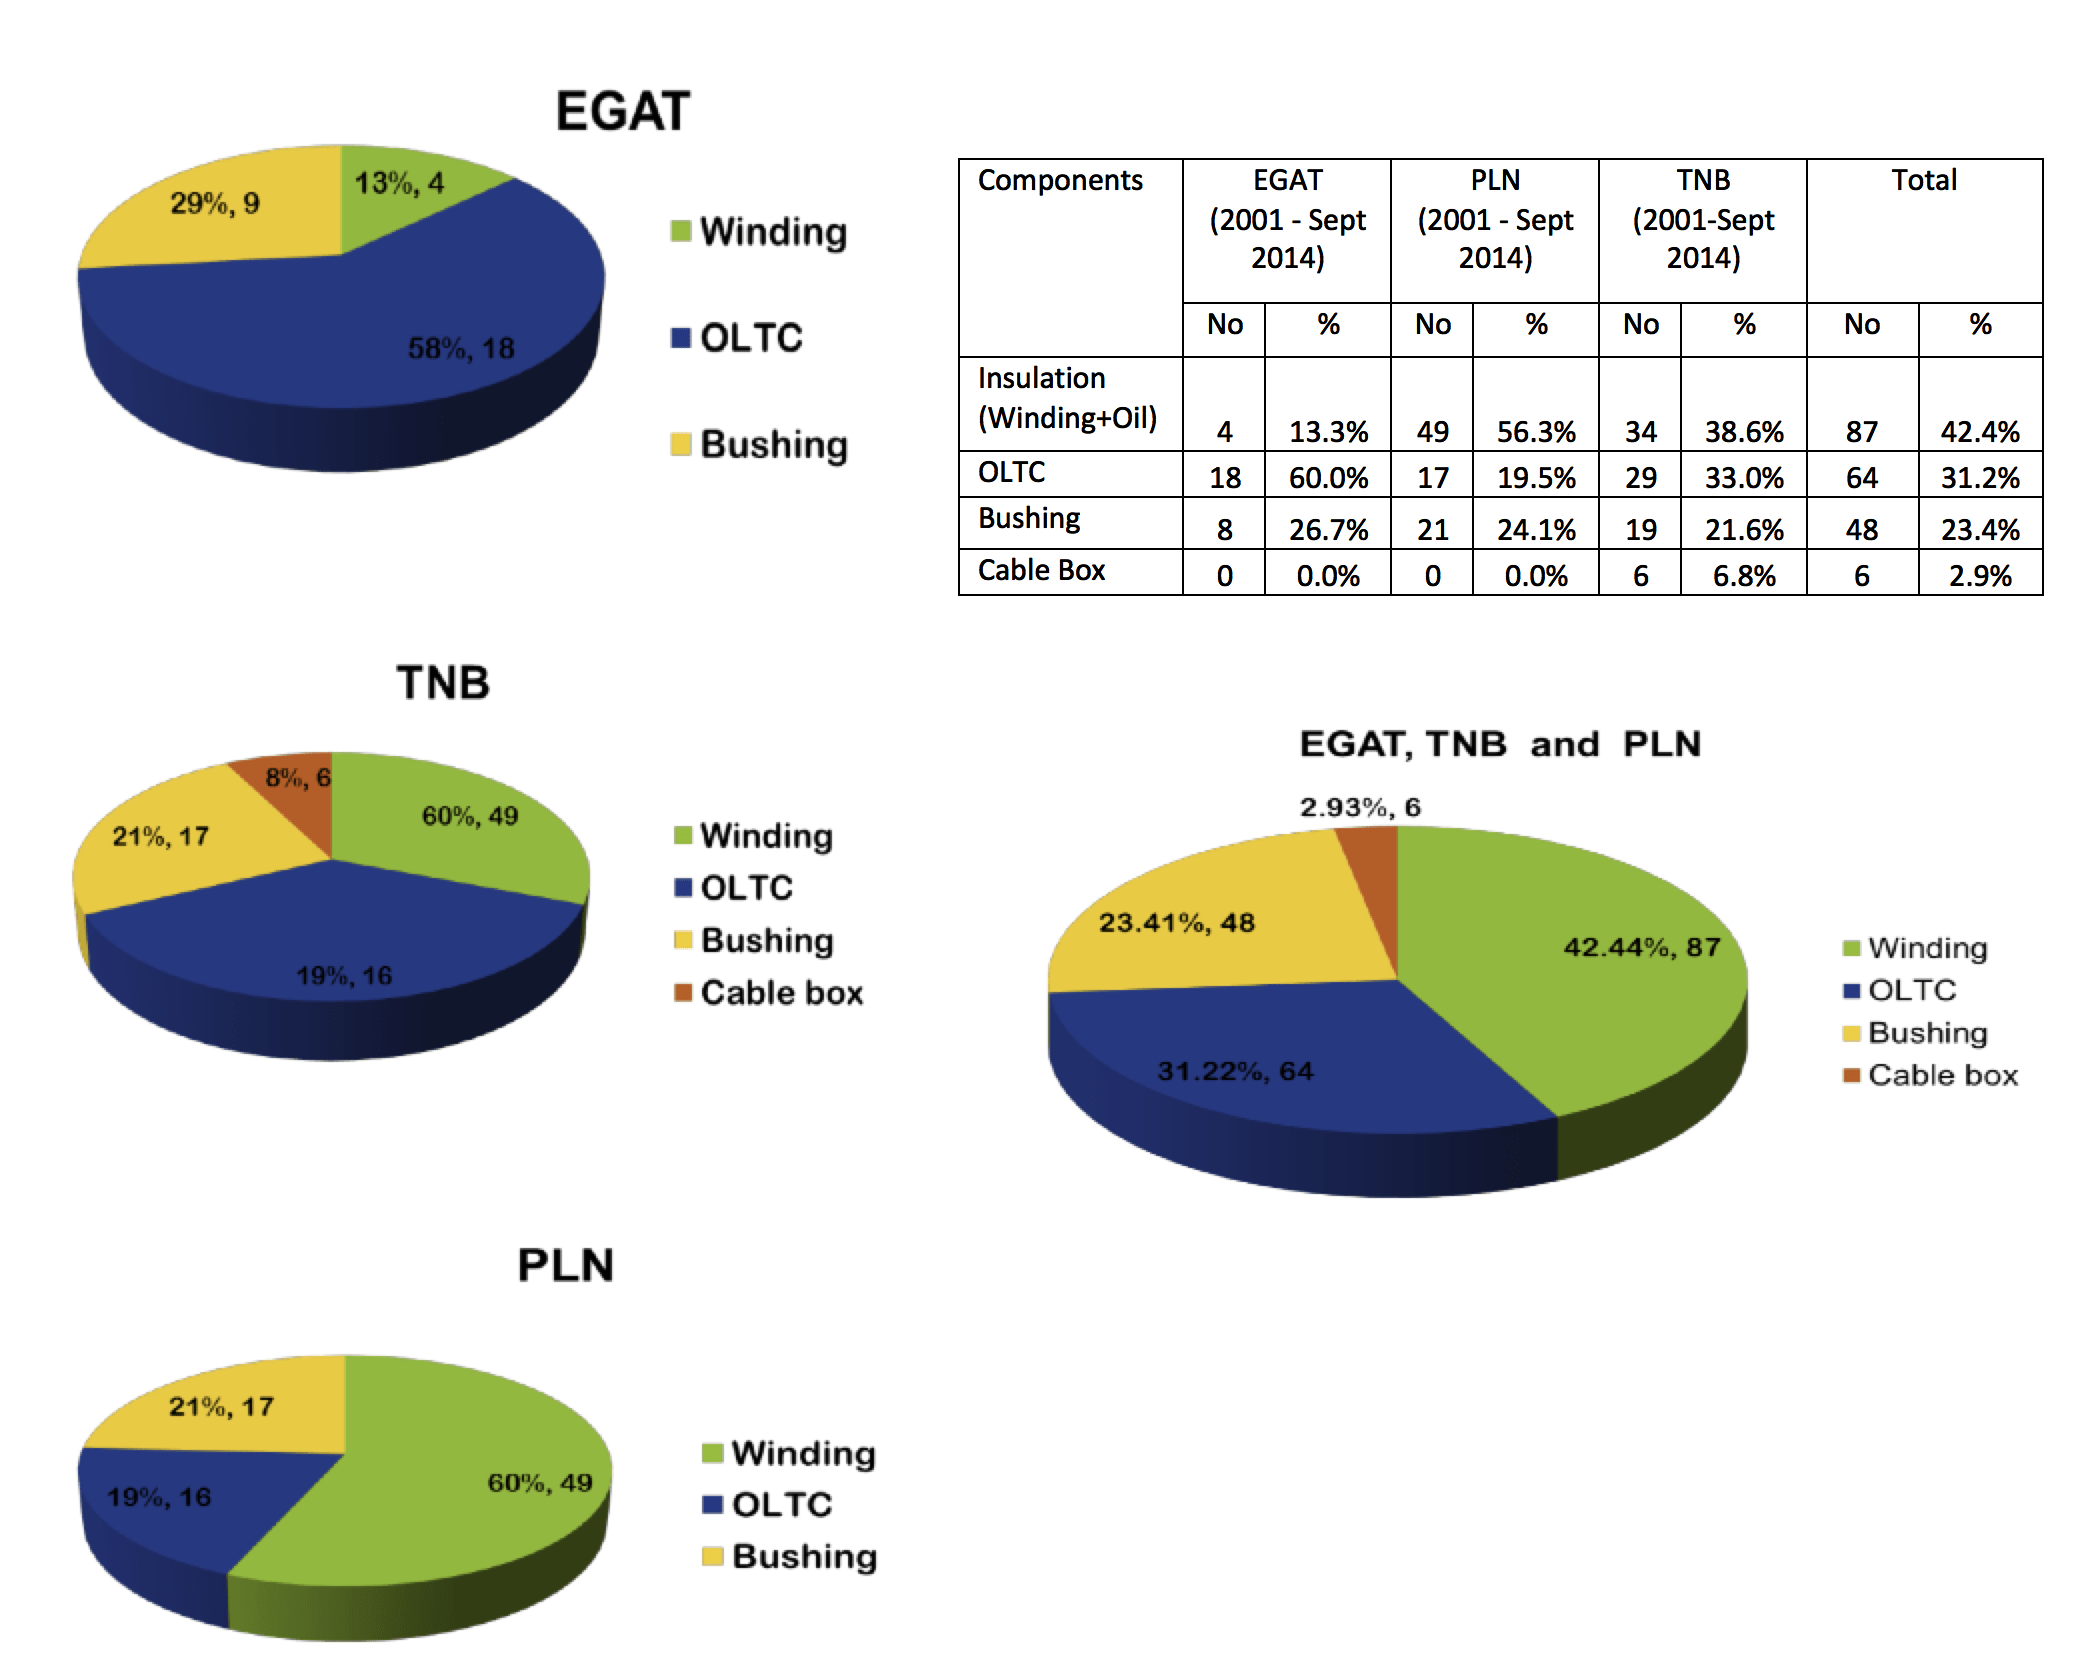
Statistics illustrating major failures of power transformers in the system of JMCC members from 2001 to late 2014 concluded that approximately 23% (or 48 of all failures) were due to bushing failure. For purposes of standardization, failure in the survey was defined as an event that involves major components of the transformer that require major repair/replacement of the component or of the transformer itself.
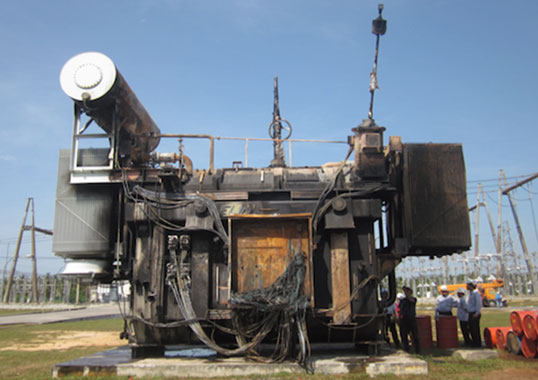
Statistics on total bushing failures and fire events since 2001 are presented in Fig. 4. Based on these incidents, it became apparent that failure of bushings within member utilities was an increasing trend initially but plateaued over last 3 years to 2015. This contributed to an average of 3.5 failures/year with a 75% fire rate among all bushing failures. No failures of RIP bushings were recorded during the survey period and improvements realized over latest 3-year period were likely due to proactive measures among utilities to mitigate increased incidence of failures.

Weibull distribution analysis for TNB, EGAT and PLN bushing failures indicates that overall life of bushing prior to failure at the 95% confidence level is predicted to be about 15.3 years on average. Fig. 5 below summarizes lifetime in years for the respective utilities, with EGAT recording highest service life record with an average of 18.97 years.
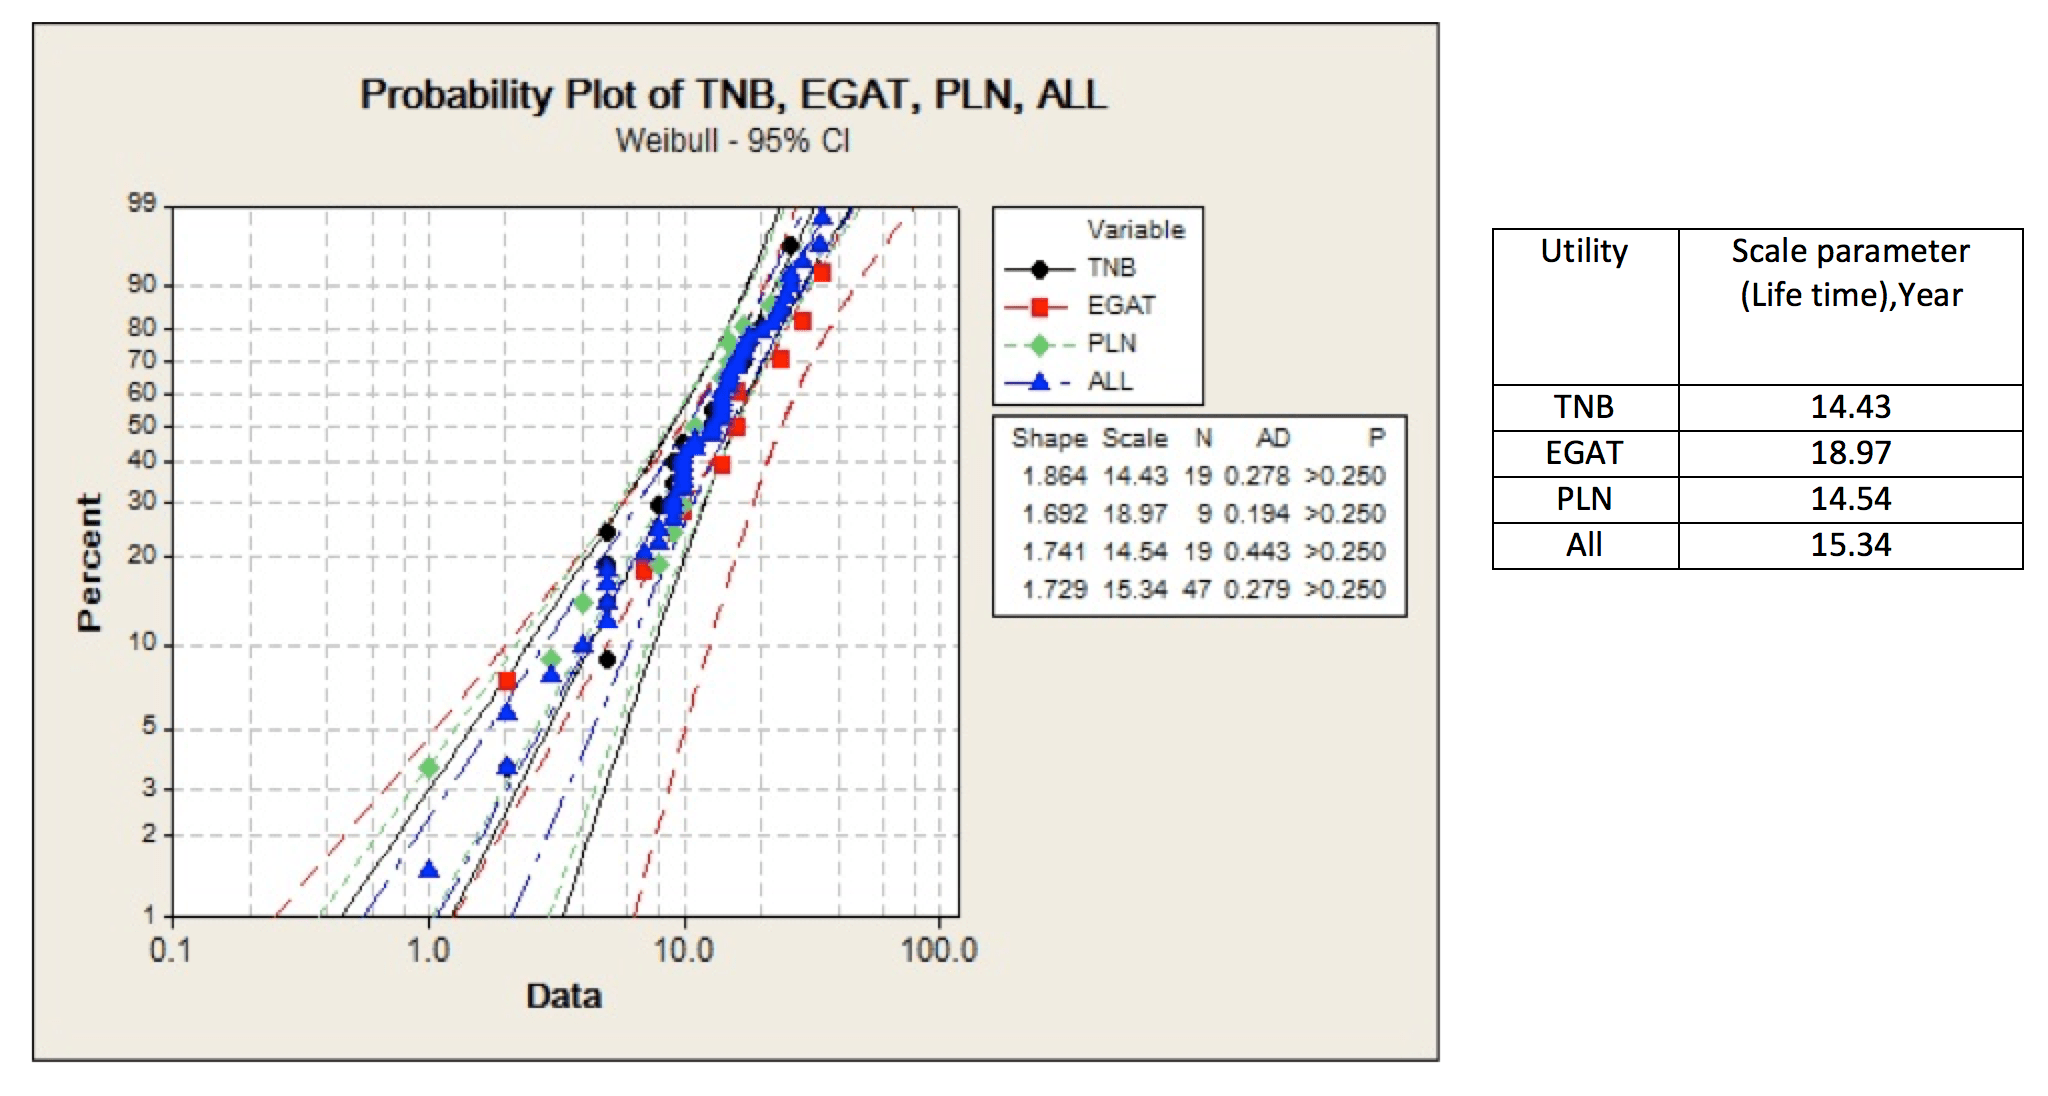
Table 1 below summarizes failure events and possible root causes, as recorded during the bushing reliability survey by EGAT-TNB-PLN from 2001 to Sept 2014. The Working Group did not perform detailed analysis of these reported root causes and simply assumed information from members was sufficiently accurate based on their interpretations.

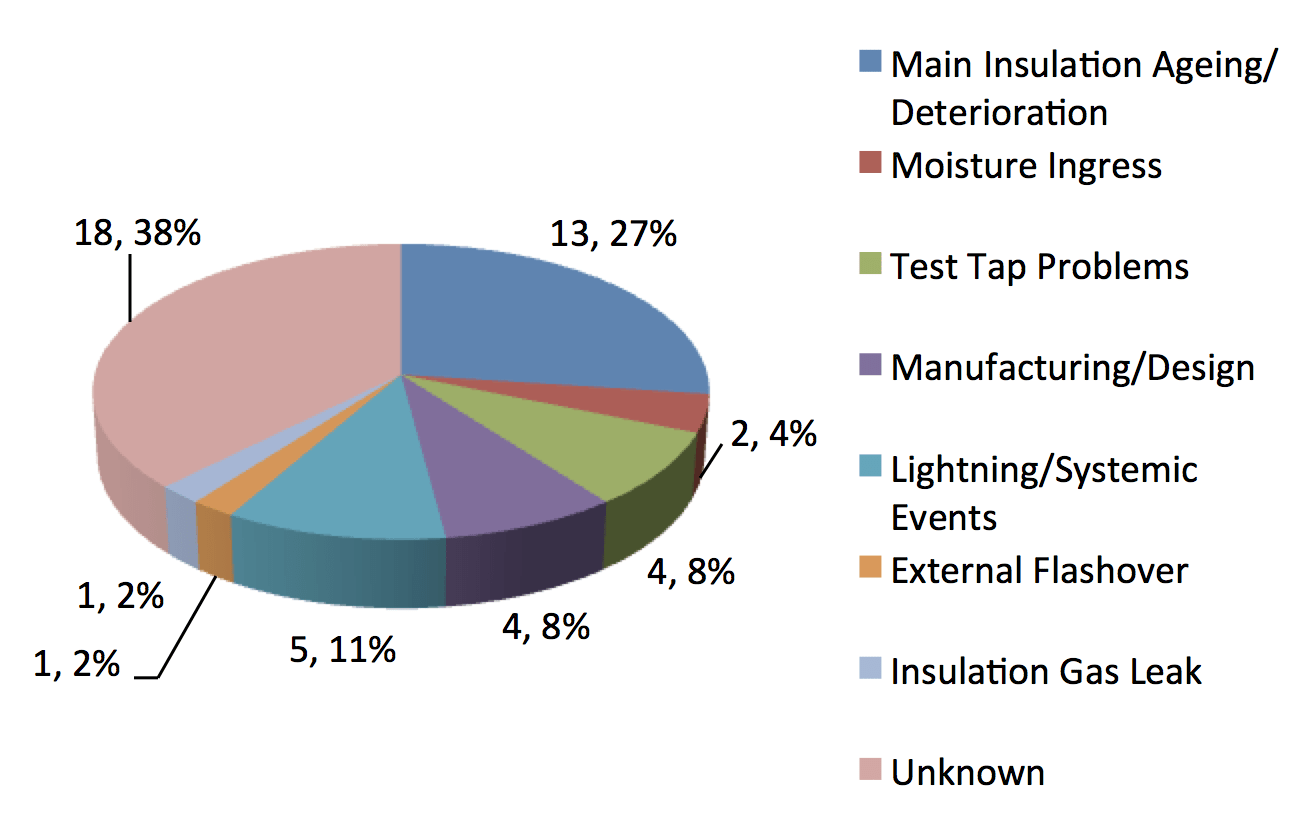
Based on the above (i.e. Table 1 and Fig. 5), it can be concluded that the high numbers of failures reported were related to main insulation issues that contributed to almost 27% of all failures. However this percentage is expected to be larger since a significant share (37.5%) of the root causes of failures were reported to be ‘Unknown’ by member utilities. The reason they were classified as ‘unknown’ can be explained by the fact that no detailed teardown analyses were conducted. Moreover, some failure incidents saw the damage to components so catastrophic that there was no possibility for analysis in the field.
Survey of Maintenance Practices
During the survey period, it was observed that utility members have some off-line and/or on-line diagnostic techniques in place in their systems to monitor bushing health. As such, the Working Group compiled these different practices in order to simplify formulation of best practices and optimum intervals for each type of maintenance activity. Table 2 summarizes the different diagnostic techniques among member utilities and shows that these vary widely depending on whether the bushings are alone or installed together and also by their application.
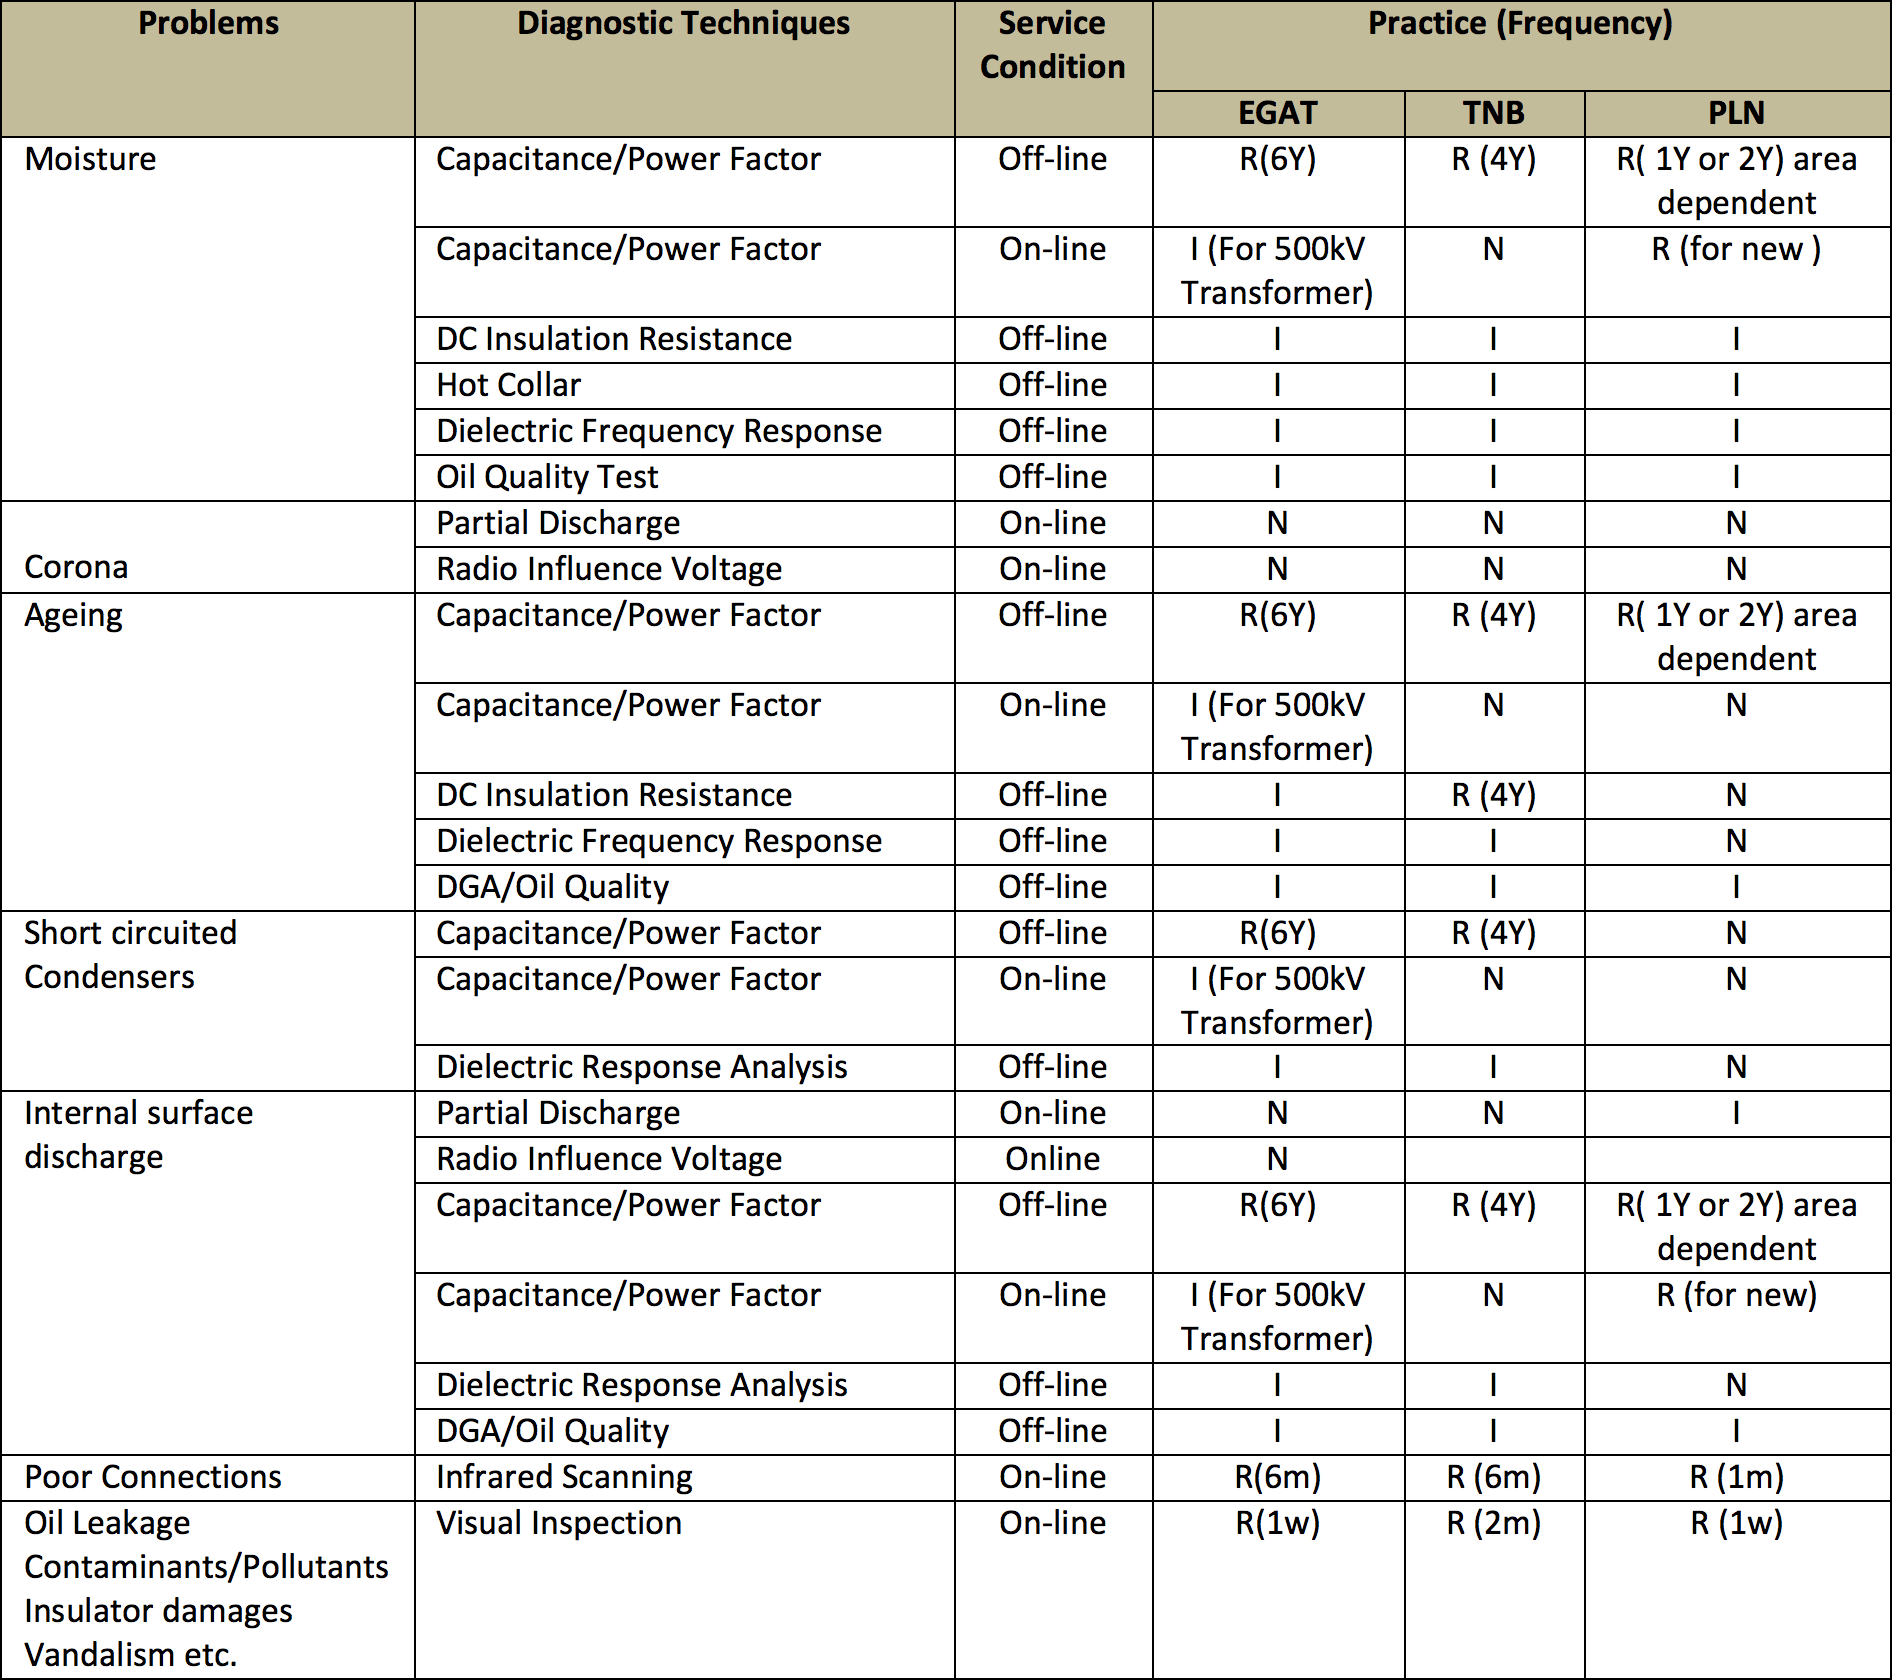
Note:
R= Routine, I = Investigative, N = Not widely practiced /under study or research
Note: Interval of testing is only stated if the test is performed as routine.
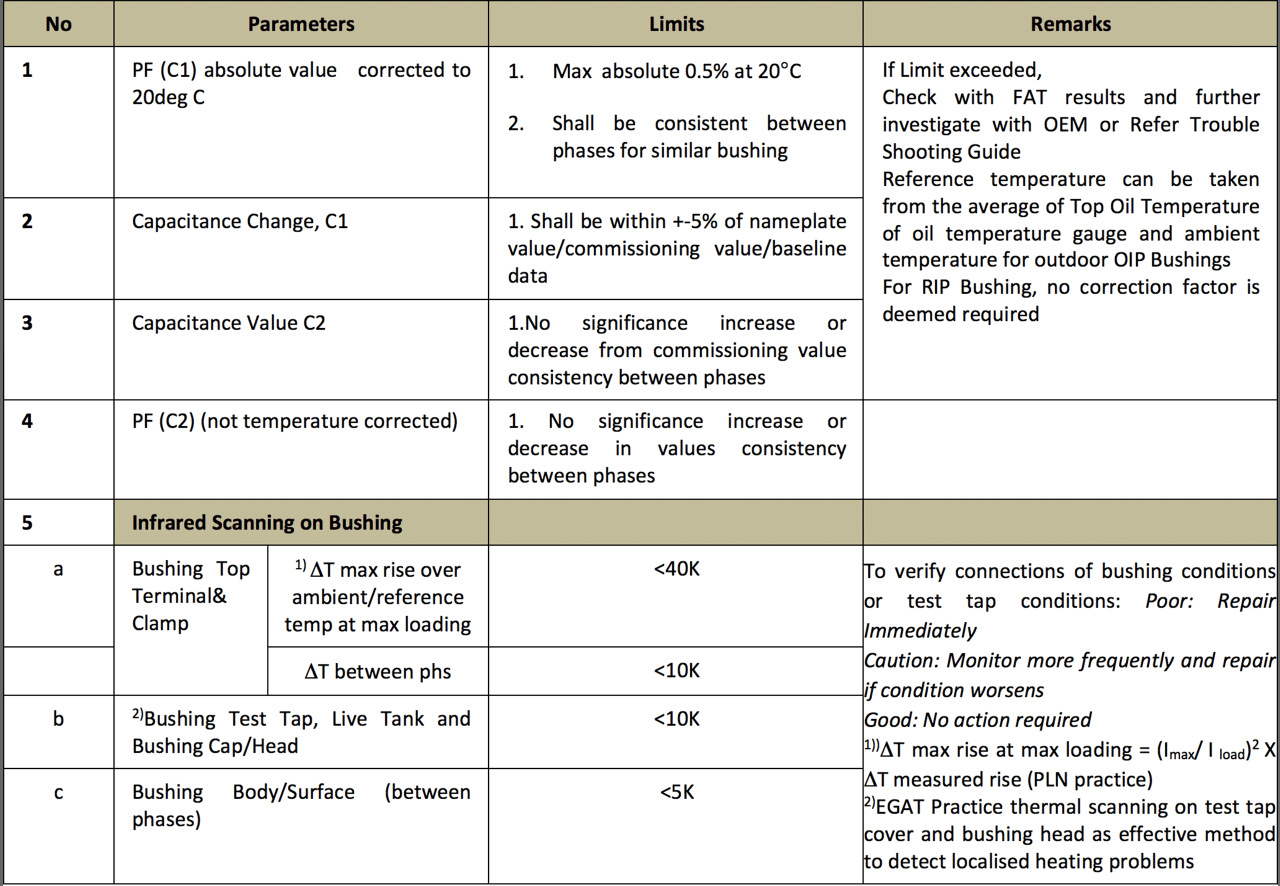
Based on this survey, in spite of variation in strategies and techniques, the most common techniques to assess condition of a bushing involved using dissipation factor (DF)/power factor (PF) and capacitance measurement. Test results were then compared in each case to nameplate values or findings from previous tests. Increases or decreases from reference values are usually an indication of contamination and/or deterioration in the insulation system. Limits for maximum permissible change tend to be manufacturer and type related and this Guide also suggests interpretation limits based on population statistics (shared among participating utilities, as shown in the section below).
The basic design of an OIP and a RIP bushing is the same. However, there are some specific differences resulting in different ageing parameters. In the case of an OIP bushing, an increase in power factor is a well-known ageing parameter. In addition, disolved gas analysis (DGA) might give information about operational reliability. Any increase in capacitance C1 indicates a partial breakdown. However, the first partial breakdown could be followed directly by complete breakdown of the insulation, resulting in catastrophic failure. Therefore, C1 is not really an adequate ageing parameter. For an RIP bushing, any partial breakdown is limited to its location without interaction with the remaining condenser core. This is due to the fact that the condenser core is solid, in contrast to an OIP condenser core where generated gases and contaminated oil distribute to the whole core. RIP bushings do not contain oil and therefore no ageing of oil could occur. An increase in the power factor is not caused by ageing directly but rather by humidity ingress that might weaken the insulation. This is usually not an issue for installed bushings but might occur from improper storage conditions. With suitable drying procedure, any humidity ingress into the condenser core can be removed.
For both bushing types, OIP and RIP, influence of stray capacitances should be taken into consideration if measured values are compared with routine test values. A fingerprint measurement taken after installation of the bushing in its final position is the best reference for further measurements.

Maintenance Guide Review
The histogram analysis in Fig. 6 was based on a total population of 4,517 measurement parameters for Power Factor. PF (C1) from the three member utilities revealed overall mean PF (C1) of approximately at 0.31% for OIP and 0.33% for RIP type bushings. But it should be noted that measurements from PLN had significant deviation from this average. Some data where PF>10% was not taken into account in this analysis since the values were assumed not realistic.
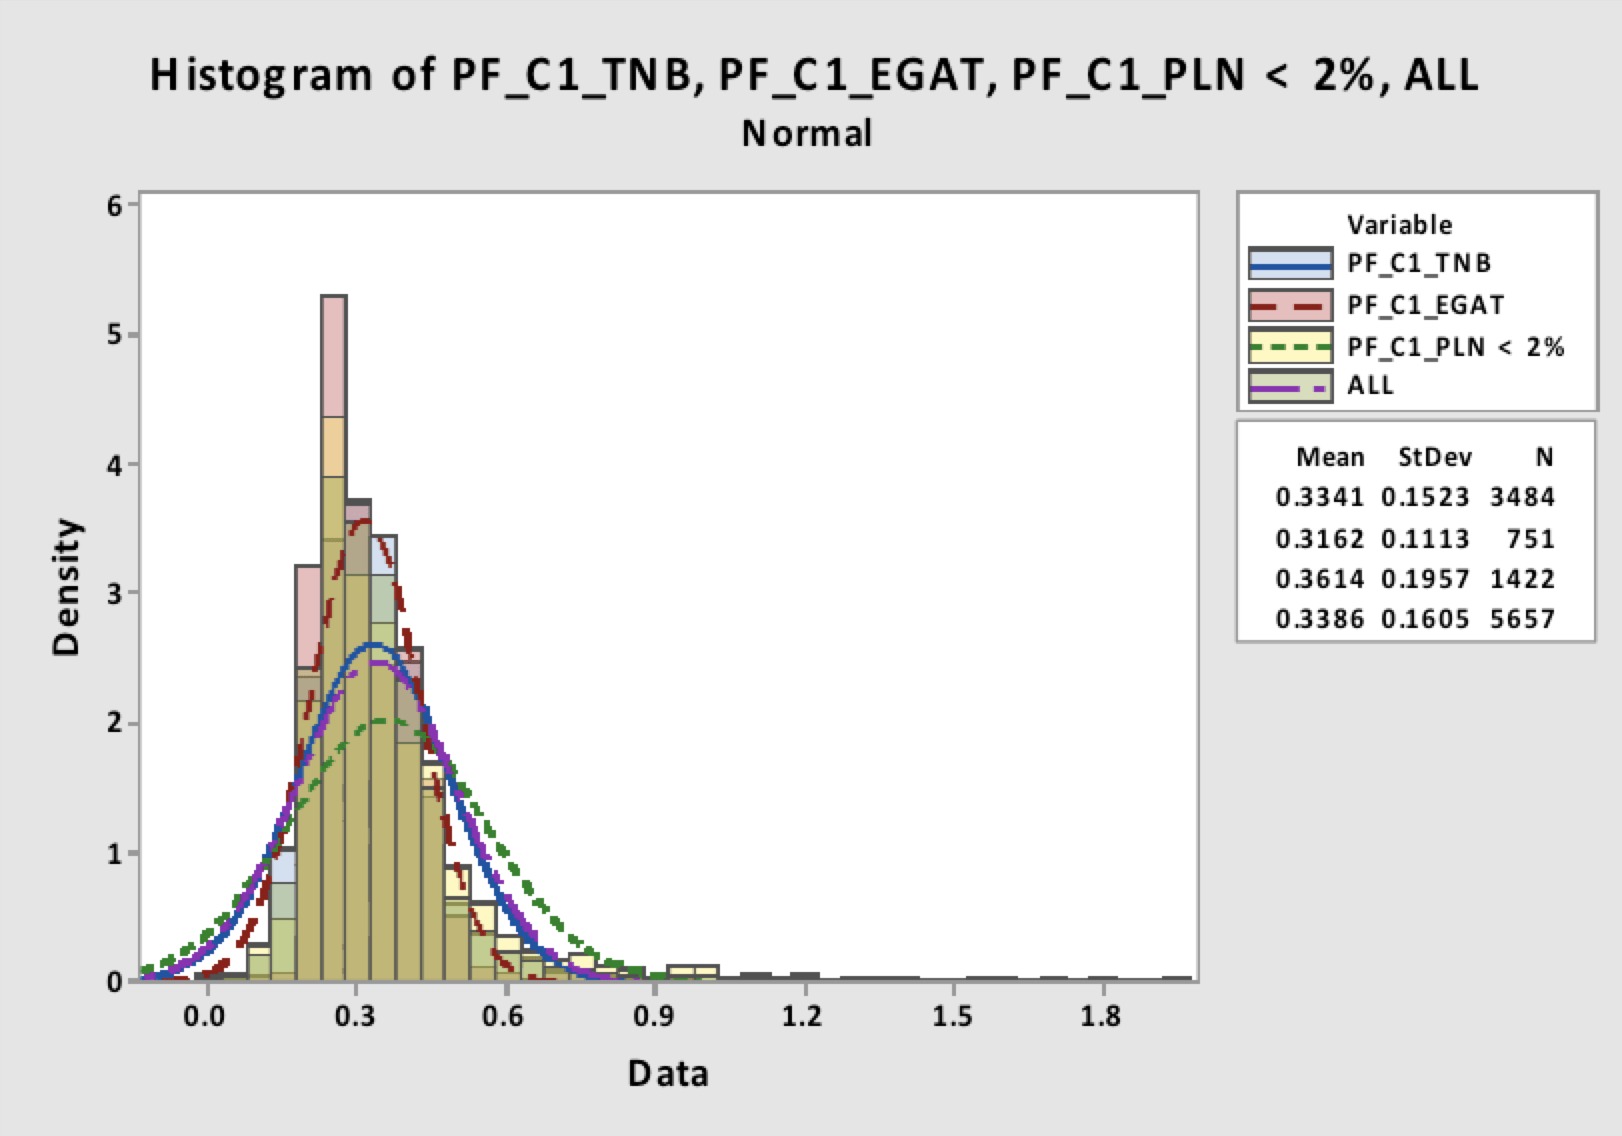
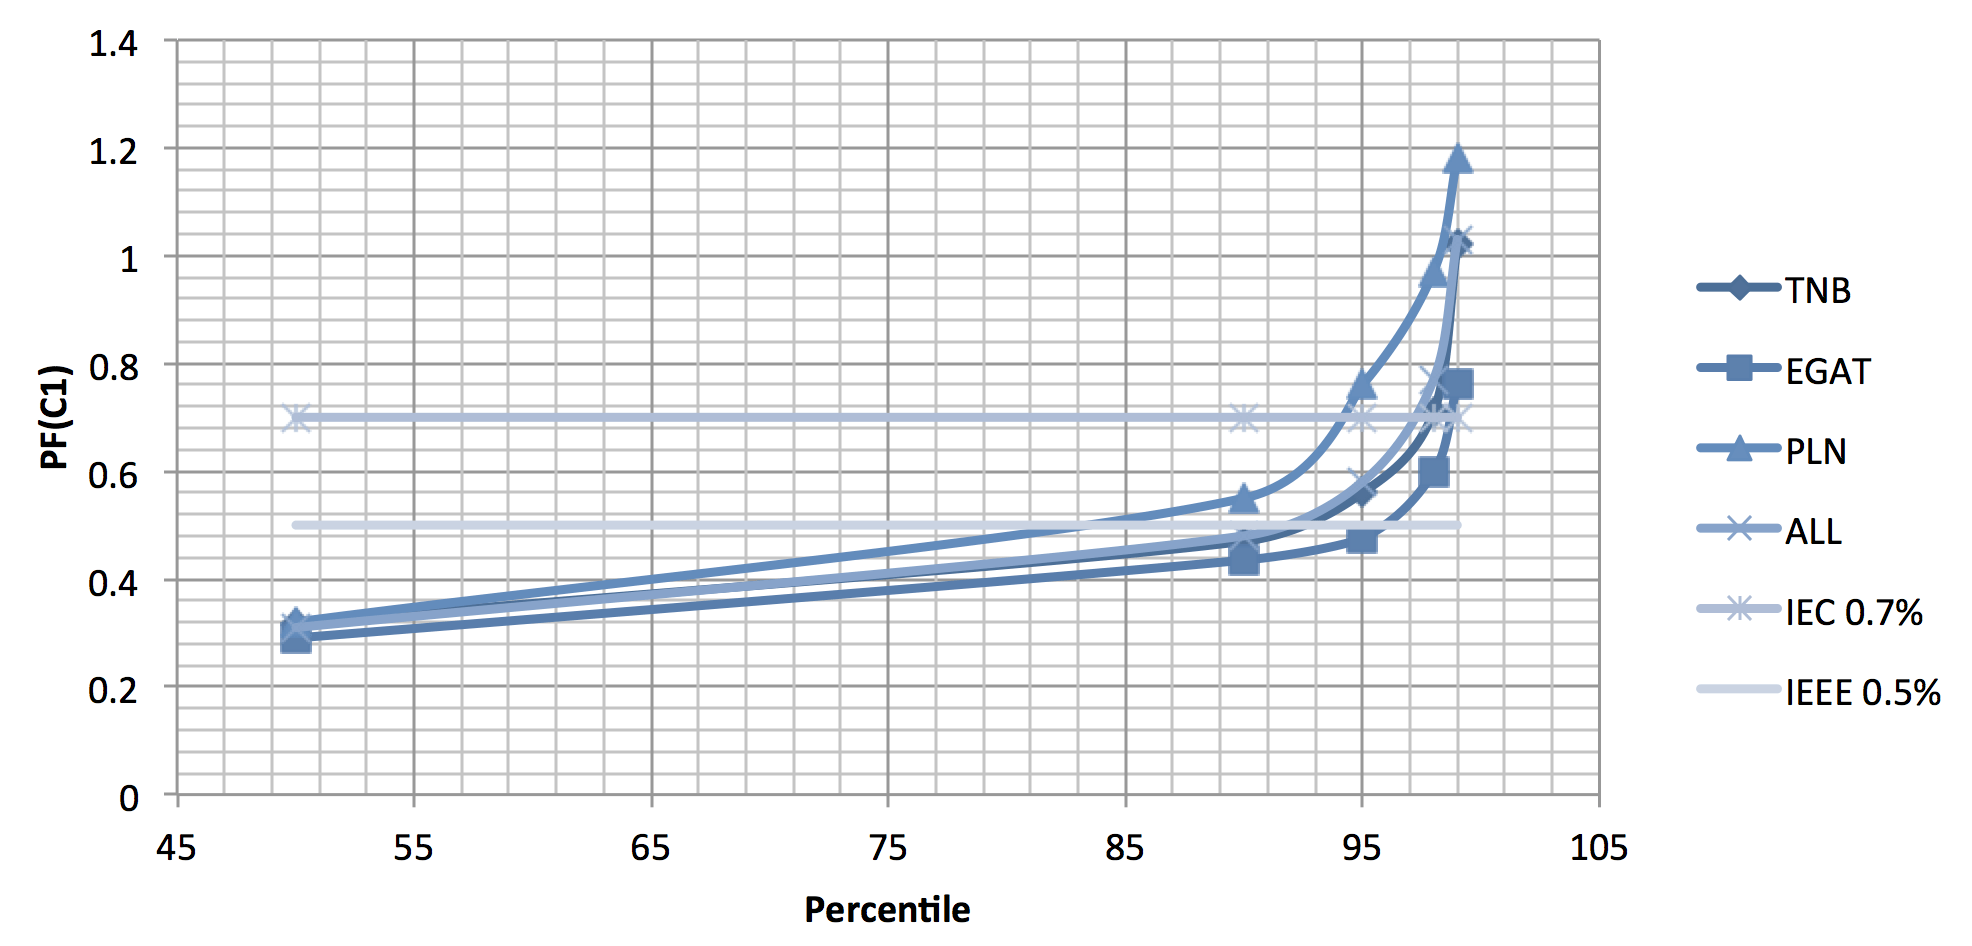
Values at different percentiles based on the above histogram analysis (shown in Table 4 and Fig. 7) indicate that degradation rate increases at approximately the 92% percentile at absolute value 0.5%. This correlates well with IEEE limits and this gradient increases significantly at the 98% percentile value, approximately at 0.7%, which correlates well against IEC limits.
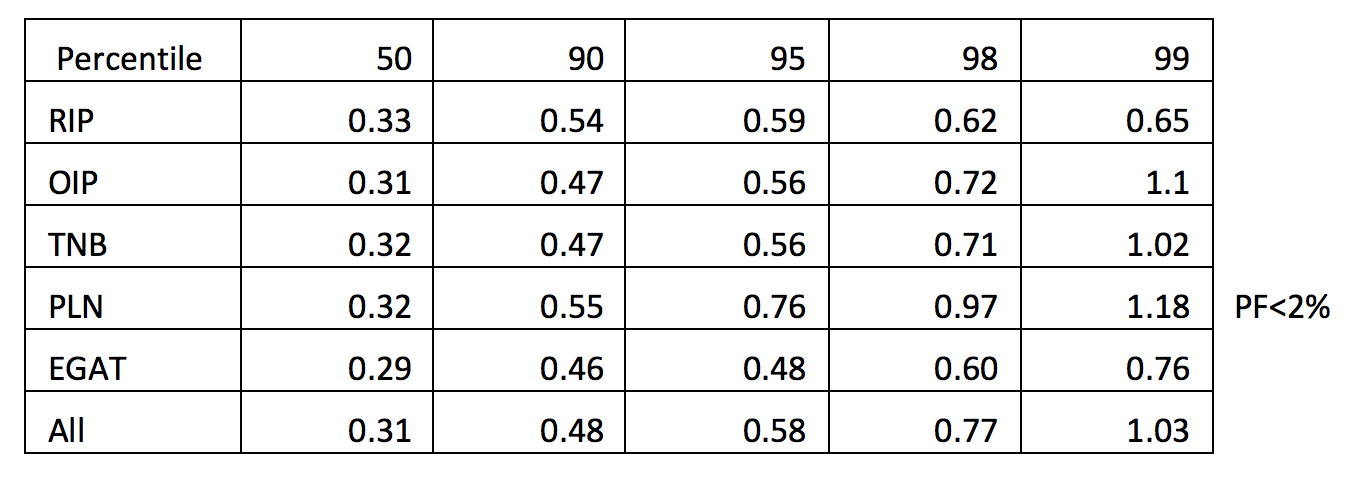
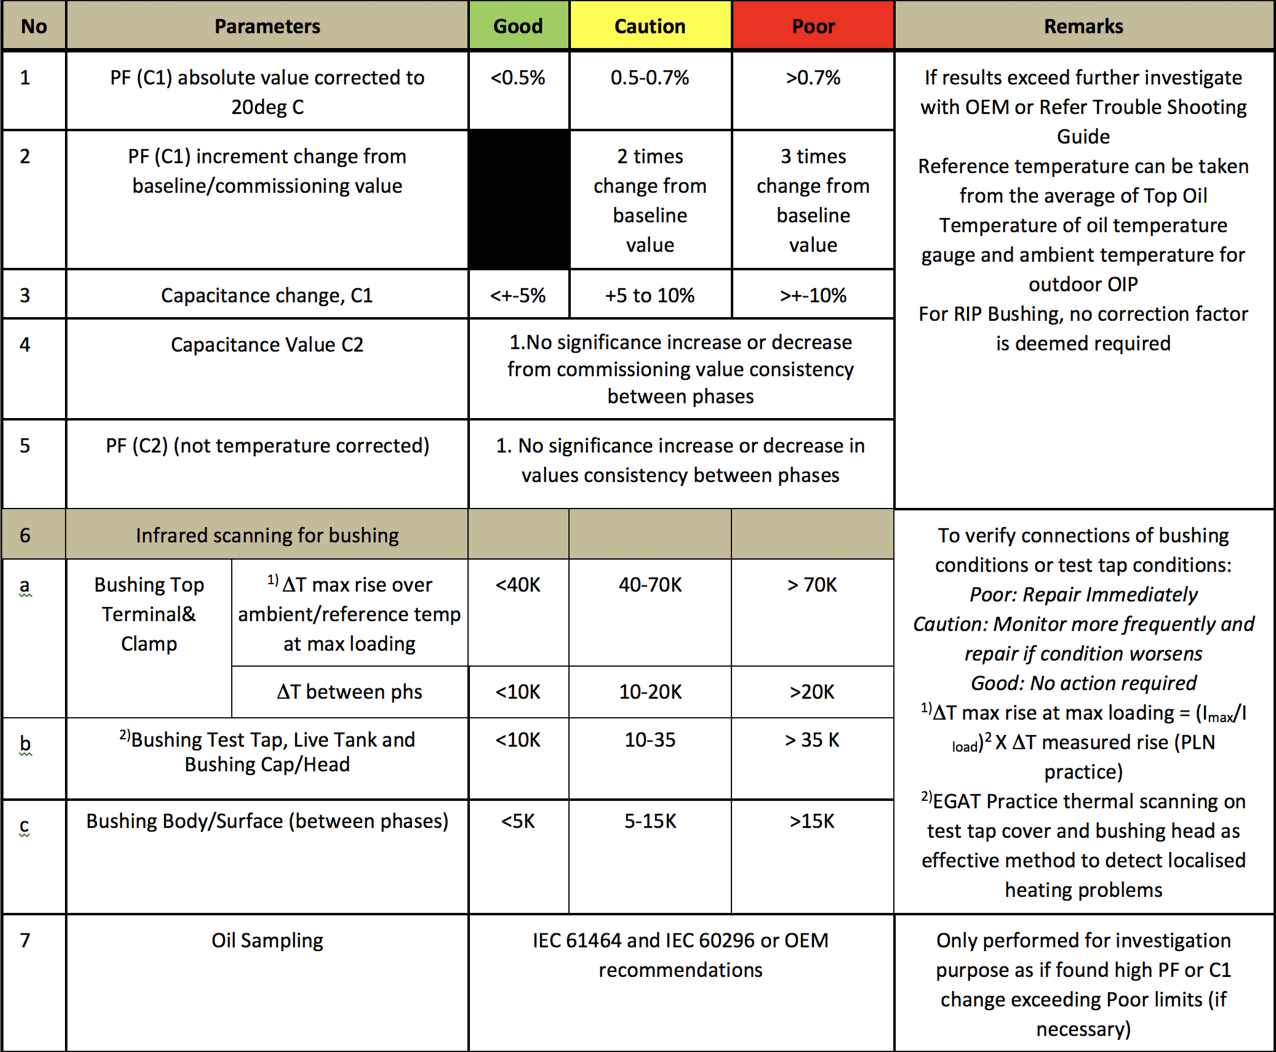
With this conclusion in mind, member utilities agreed that 90% percentile will be taken as a ‘good limit’ for bushings in service as well as new units. ‘Caution limits’ are within 95 to 98% limits. Beyond 98% limits, a bushing is deemed in poor condition and requires urgent attention to prevent failure. Utility members also deliberated and decided that a bushing’s absolute PF value is dependent on material and design. Thus, bushing assessment based on absolute values may not be a good indicator in all cases. It was also agreed that any significant change from initial commissioning or baseline value should raise concern and require urgent remedial action. This information was then used as the basis to review existing maintenance criteria practiced by utility member and to formulate standards for new, under warranty and in service conditions.
