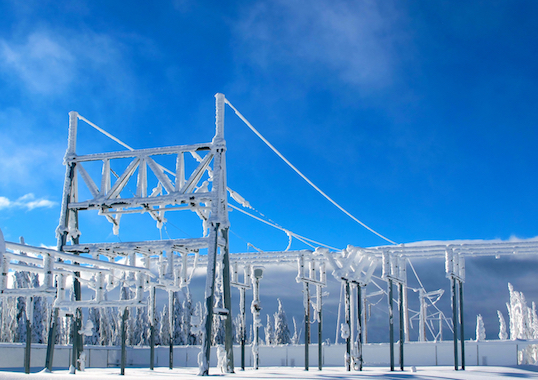
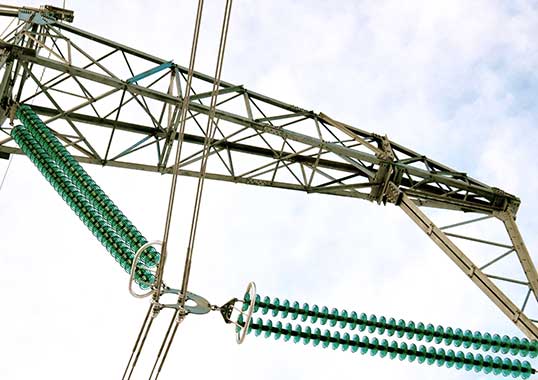
Partial or complete bridging of insulator dry arc distance by ice or snow can lead to greatly reduced electrical reliability, particularly in the transition temperature range between -2 to 0°C. As example, a severe snowstorm in northern Japan a decade ago led to one of the country’s worst outages and affected 650,000 households for up to 31 hours. In a country with one of the highest levels of reliability, this was truly extraordinary. The massive blackout was induced by wet snow mixed with sea salt that had packed the sheds of porcelain long rod insulators on 66 kV as well as 154 kV lines.
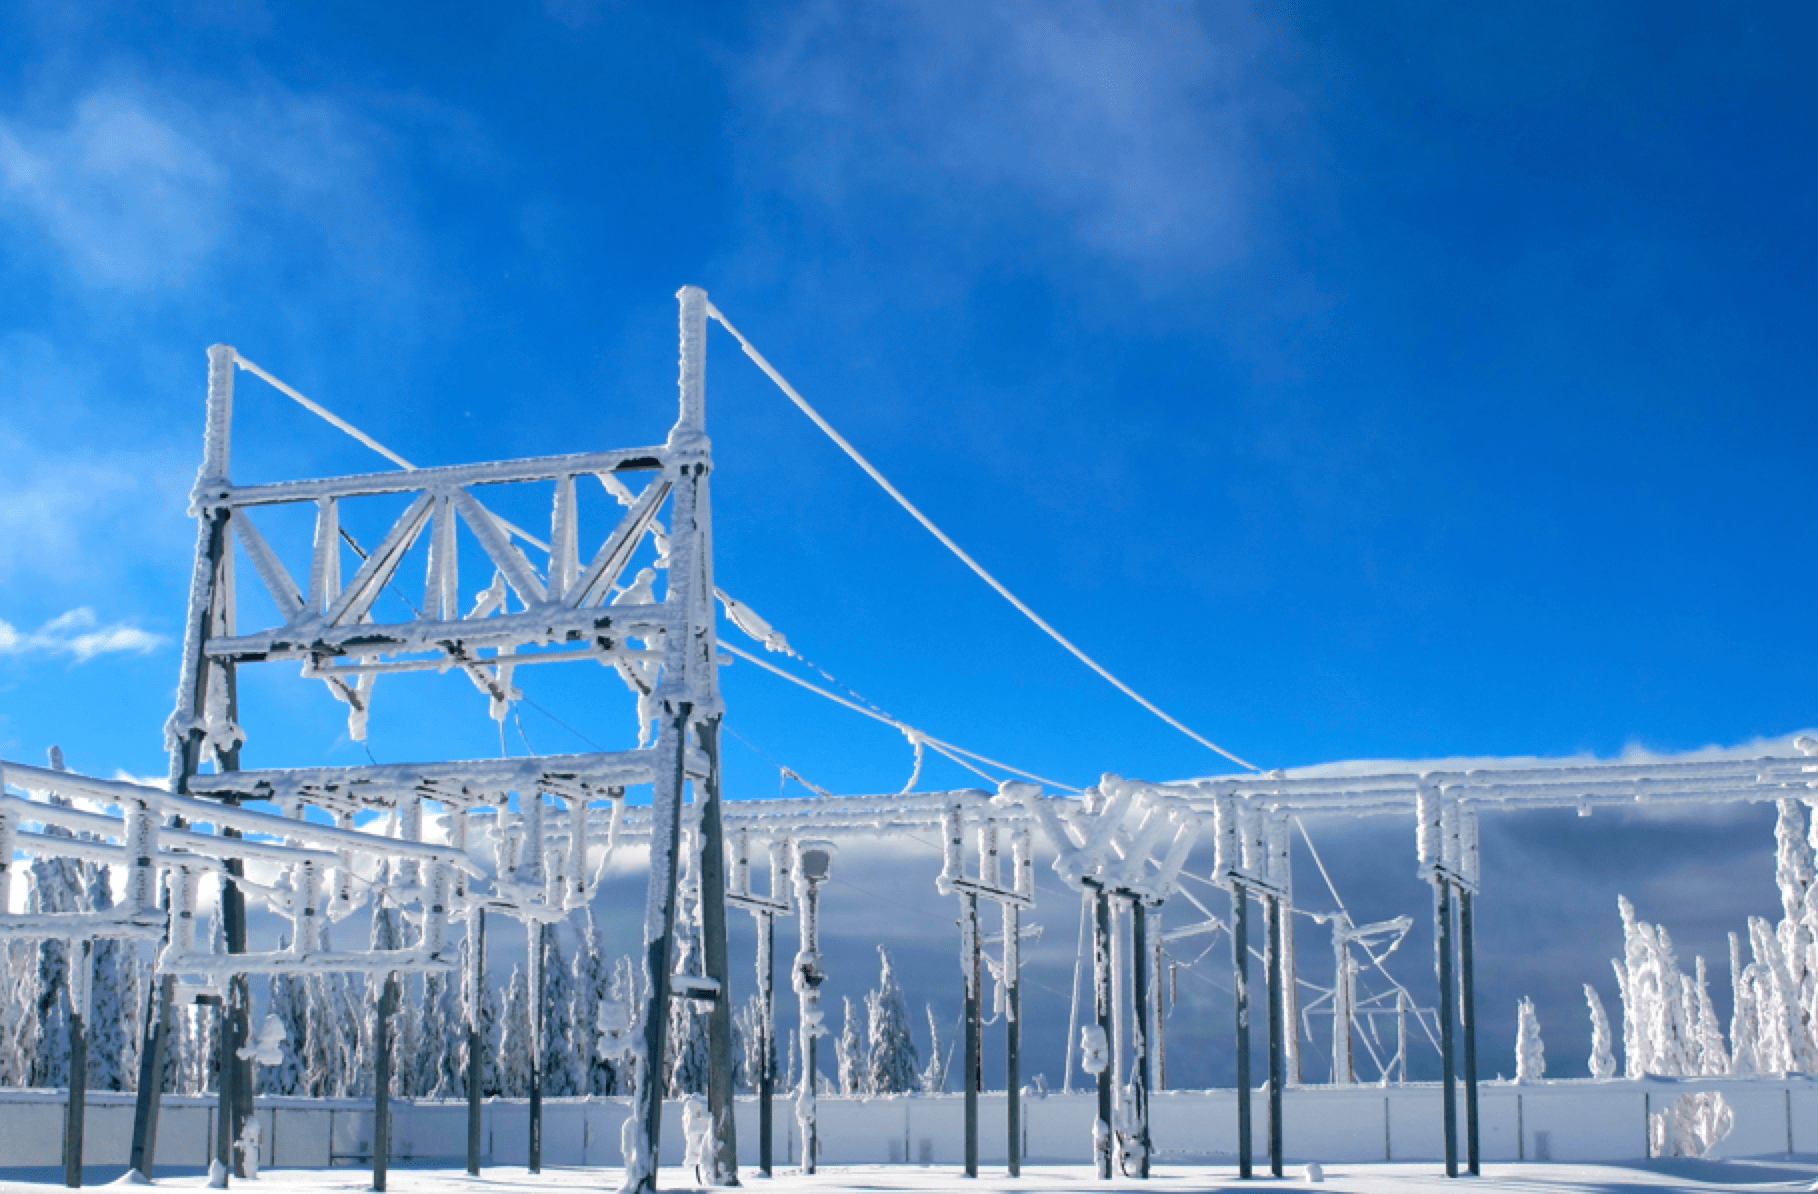
Ice and snow flashovers – even when not of such scale – have long been known to cause sporadic problems on 115 and 230 kV systems. Then, during the late 1980s, such events also came to be recognized as a factor limiting reliability of EHV and UHV systems – especially when coupled with existing surface contamination. New icing test methods for such situations were therefore standardized as part of the IEEE Dielectrics & Electrical Insulation Society as well as the Power and Energy Society Guide to Test Methods and Procedures to Evaluate the Electrical Performance of Insulators in Freezing Conditions (IEEE Standard 1783TM-2009). According to this standard, icing tests must incorporate normal line voltage stress up to 100 kV AC line-to-ground per meter of dry arc distance in the ice accretion and flashover processes.
Service experience in several countries subsequently led to further design guidance on exposure factors such as weight of ice per unit length, ice conductivity and surface pollution prior to any icing event. These factors were then combined to establish suitable insulator dry arc and leakage distances in IEEE’s Standards Project P1820 (Guide on the Selection of Transmission and Distribution Insulators with Respect to Icing).
This article, based on a past contribution by INMR Columnist, William Chisholm, and Masoud Farzaneh, UQAC Industrial Chair on Atmospheric Icing of Power Network Equipment (CIGELE) and Canada Research Chair on Atmospheric Icing Engineering of Power Networks (INGIVRE), reports on additional progress in this area.
Standard mechanical design methods and specifications have traditionally relied on regional loading zones that give thickness of radial ice accretion as well as wind pressure on the ice. IEEE’s Guide on overhead line design criteria, for example, offers advice about how this should be organized early on in the design process since it affects selection of many components.

CLICK TO ENLARGE
Unlike early understanding of the mechanical problems that can result from ice accretion, it took the power industry a century more to fully recognize problems relating to electrical aspects of ice and snow deposits on insulators. In fact, these only came to the forefront during the 1980s and 90s as EHV stress levels at line voltage crept above the 70 kV/m dry arc level required to ensure good performance. However, even lower voltage lines having this stress level can be highly vulnerable to icing. During a severe ice and snow episode in China’s Hunan Province early in 2008, there were over 2000 flashovers reported on 110 kV lines, 683 flashovers on 220 kV lines and 126 flashovers on critical 500 kV lines.

CLICK TO ENLARGE
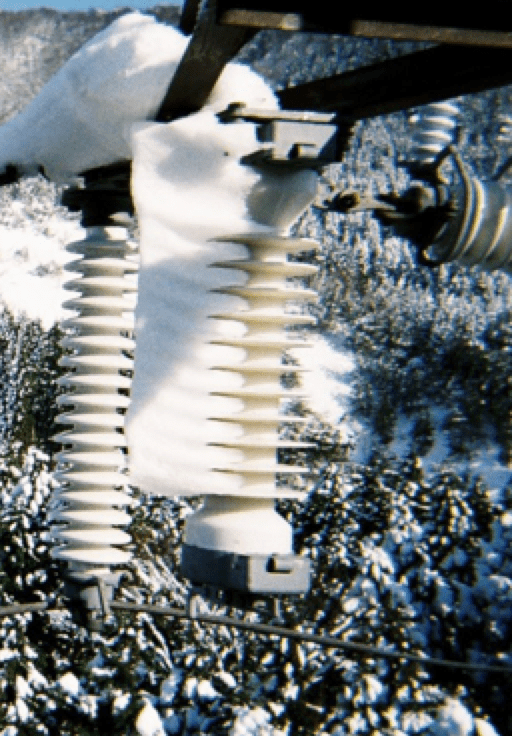
Freezing rain occurs during winter and early spring in many parts of the globe. A rare severe ice storm or occurrence of two or more moderate storms without a melting period between them can lead to heavy accumulation of glaze ice that bridges insulator leakage distance. Flashovers can then occur across the ice surface, spanning metal-to-metal dry arc distance under melting conditions that lead to a continuous surface film of water.
CLICK TO ENLARGE
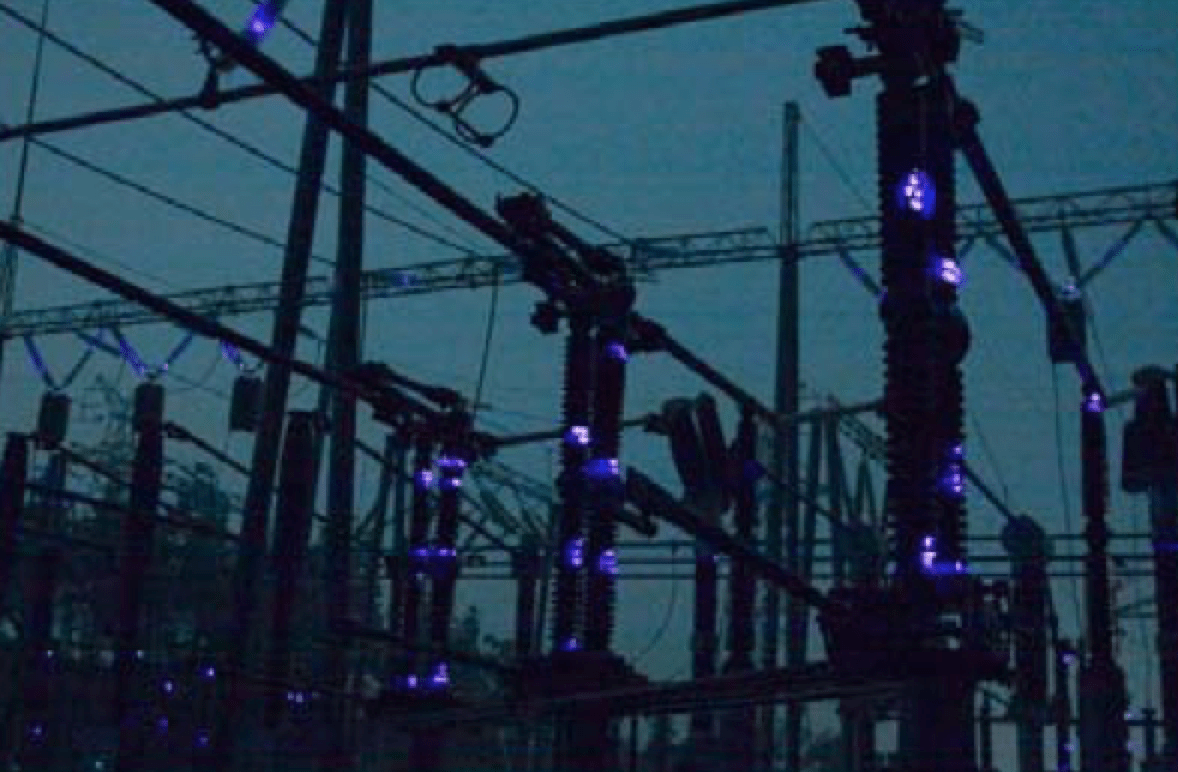
Colder areas (e.g. Ontario in Canada or northern regions of China) are also especially vulnerable to coldfog flashovers, when pre-existing surface pollution is wetted by natural fog at temperatures just below freezing. In this case, the pollution is stabilized during accumulation of the very thin ice layers on all surfaces. The fog layer acts as a heavy non-soluble deposit (NSDD). When the temperature increases above 0°C, flashover strength under cold fog conditions matches results found in clean-fog tests at the same equivalent salt deposit density (ESDD) levels.
CLICK TO ENLARGE
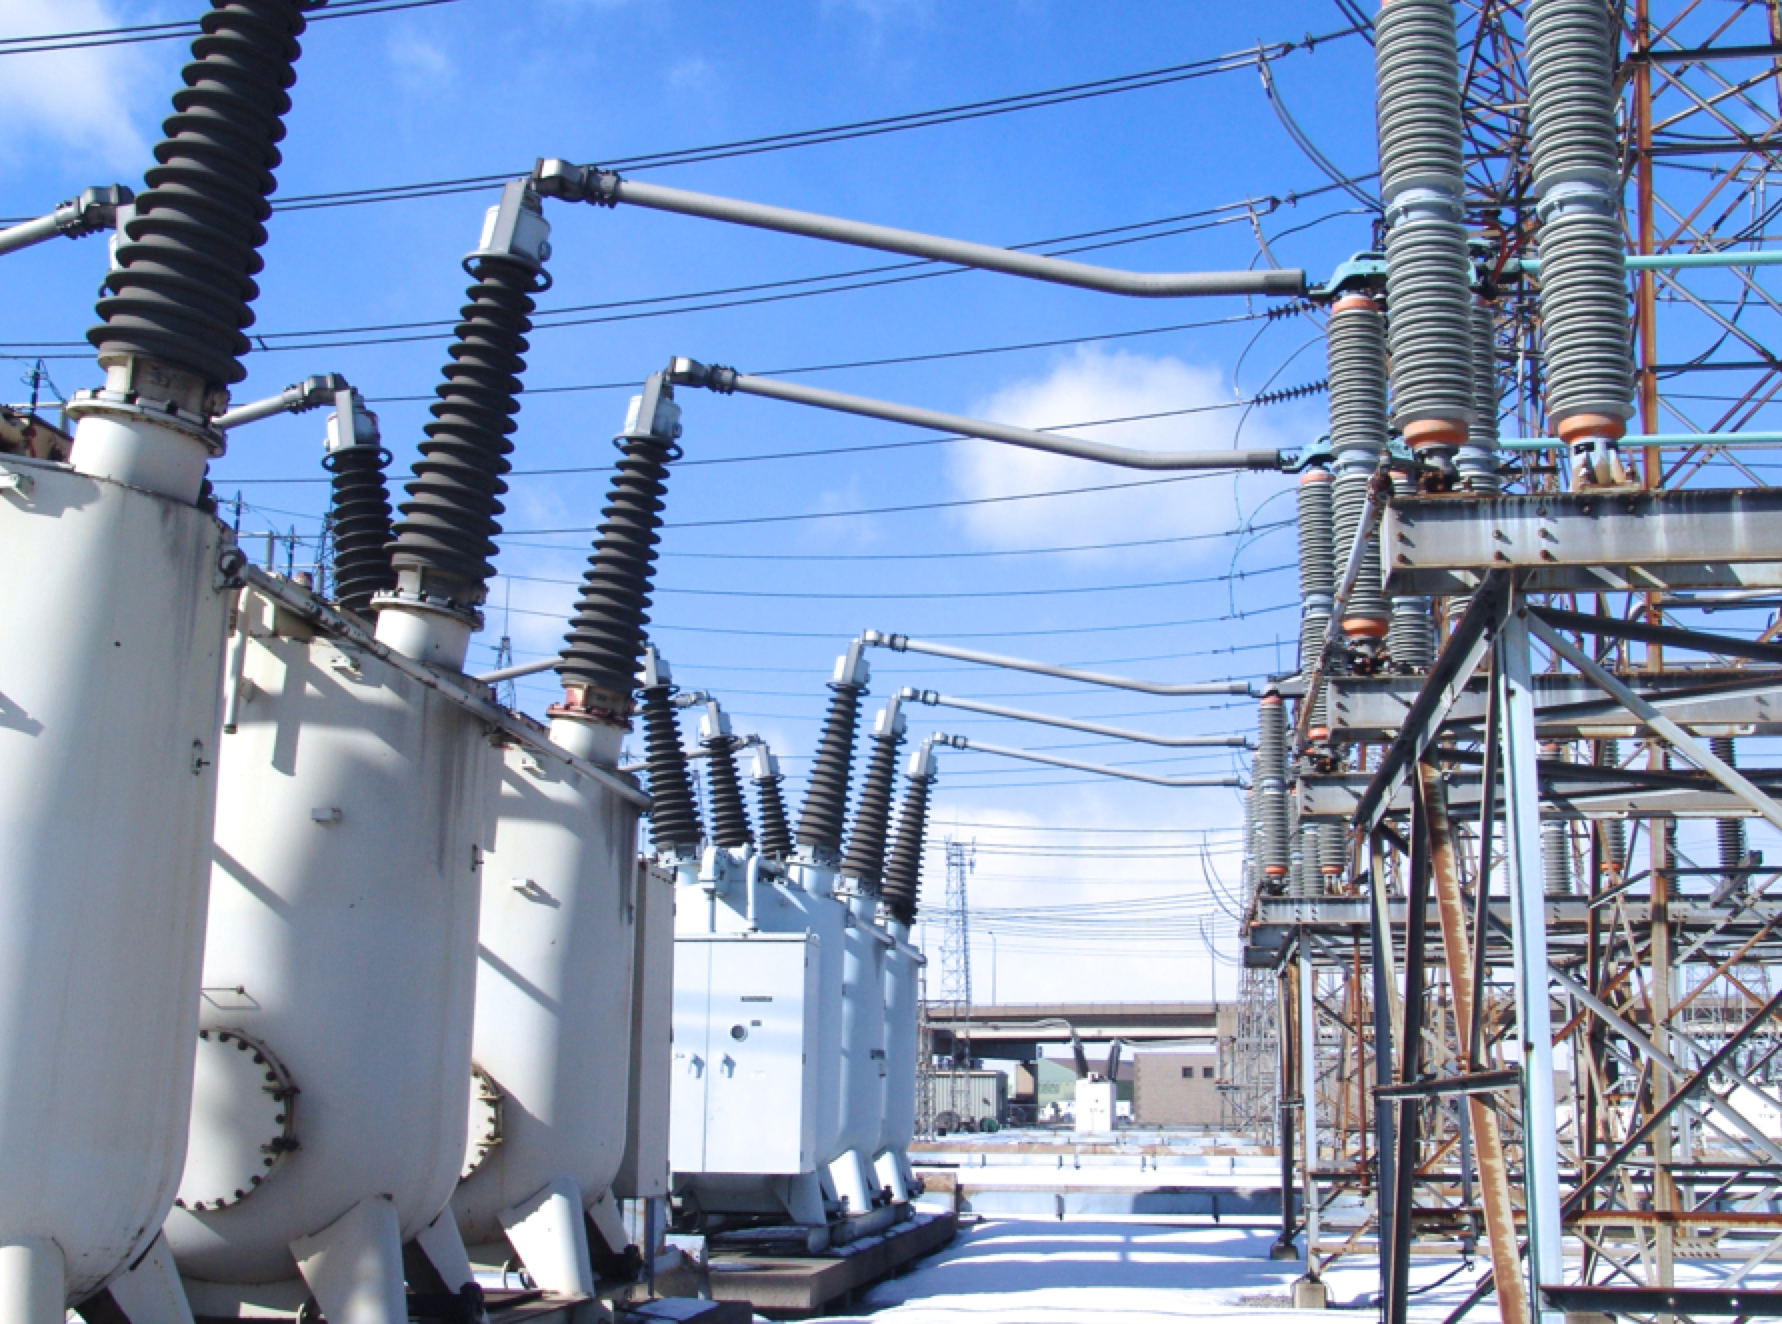
For example, on one December day 25 years ago, more than a million dollars worth of porcelain insulators at a key substation in Hamilton, Ontario were destroyed by flashovers triggered by cold fog interacting with accumulated road salt pollution from a nearby highway overpass. Two years later, there were 20 different phase-to-ground flashovers – all taking place over a single night. The situation with flashovers became so bad the following December that all 230 kV beakers were simultaneously put out of operation, effectively shutting down the station.
Another unique cold-fog contamination flashover process has also recently surfaced, namely the possibility of flashover of live-line tools under wintry conditions. While tools are maintained exceptionally clean, especially compared to outdoor insulators, they have no additional leakage distance across their dry arc path and thus have a creepage factor CF=1.0. Cold-fog test methods have been adapted to reproduce flashovers across live-line tools even at very low contamination levels, e.g. where ESDDs are below 3 μg/cm2 (i.e. 0.003 mg/cm2).
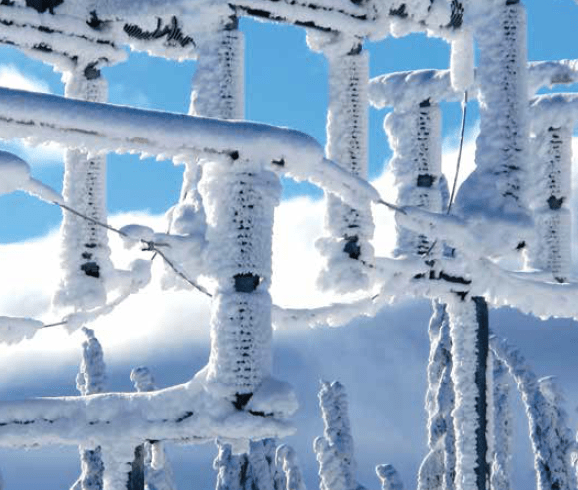
Conditions of greatest risk to 1550 kV BIL post insulators operated at 500 kV in urban areas might be a combination of pre-existing pollution from road salt followed by light ice accretion and partial bridging by icicles. Indeed, there has been increasing interest in electrical performance in this light icing range, i.e. between fog accretion on all insulator surfaces and full ice bridging.
Classification of light icing calls for radial accumulation thickness of t<6 mm on a rotating reference cylinder, corresponding to accumulation of <12 mm at ground level. At 6<t<10 mm (i.e. moderate icing accretion), a station post insulator having a uniform profile becomes fully bridged. A cap & pin ceramic insulator string remains un-bridged although icicles can penetrate the areas between the cap and the pin. Heavy icing is defined as radial thickness t>10 mm, yielding ice deposits that fully bridge 146 x 254 mm insulator strings with icicles.
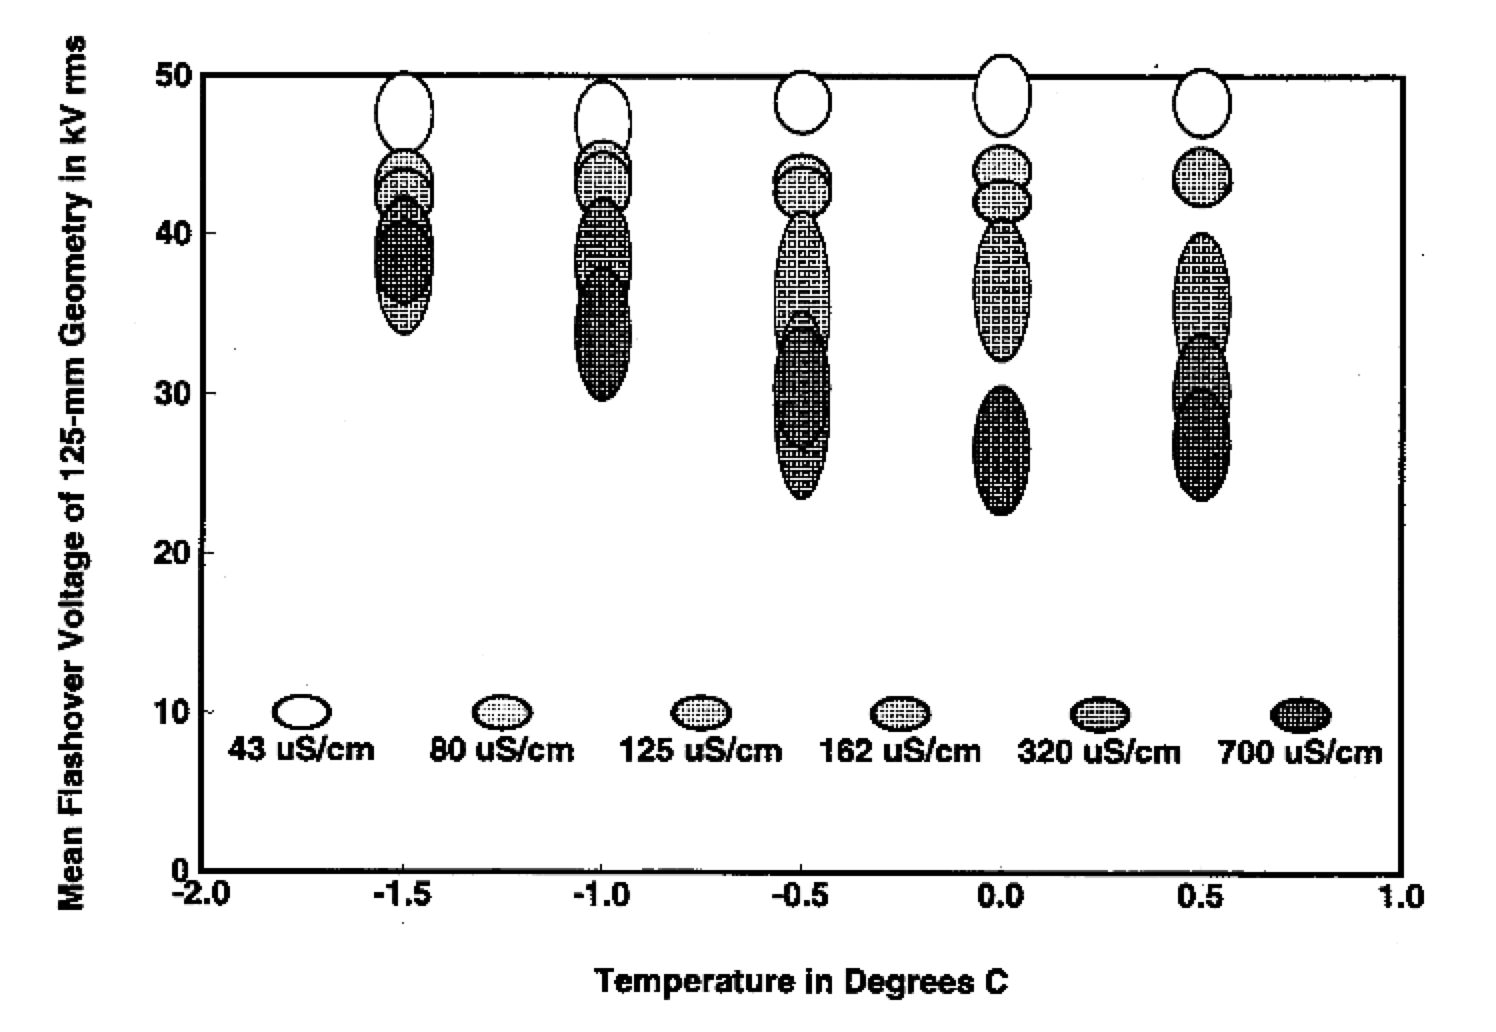
Penetration of conical icicles into the shed-to-shed gaps under light or moderate icing has minimal influence on flashover strength if ice conductivity (σW) is≤80 μS/cm. Yet Fig. 1 demonstrates that a significant reduction in 125 mm plane-to-plane flashover strength occurs with only σW≥320 mS/cm should the surface temperature of the 75 mm long icicles exceed -1°C.
CLICK TO ENLARGE
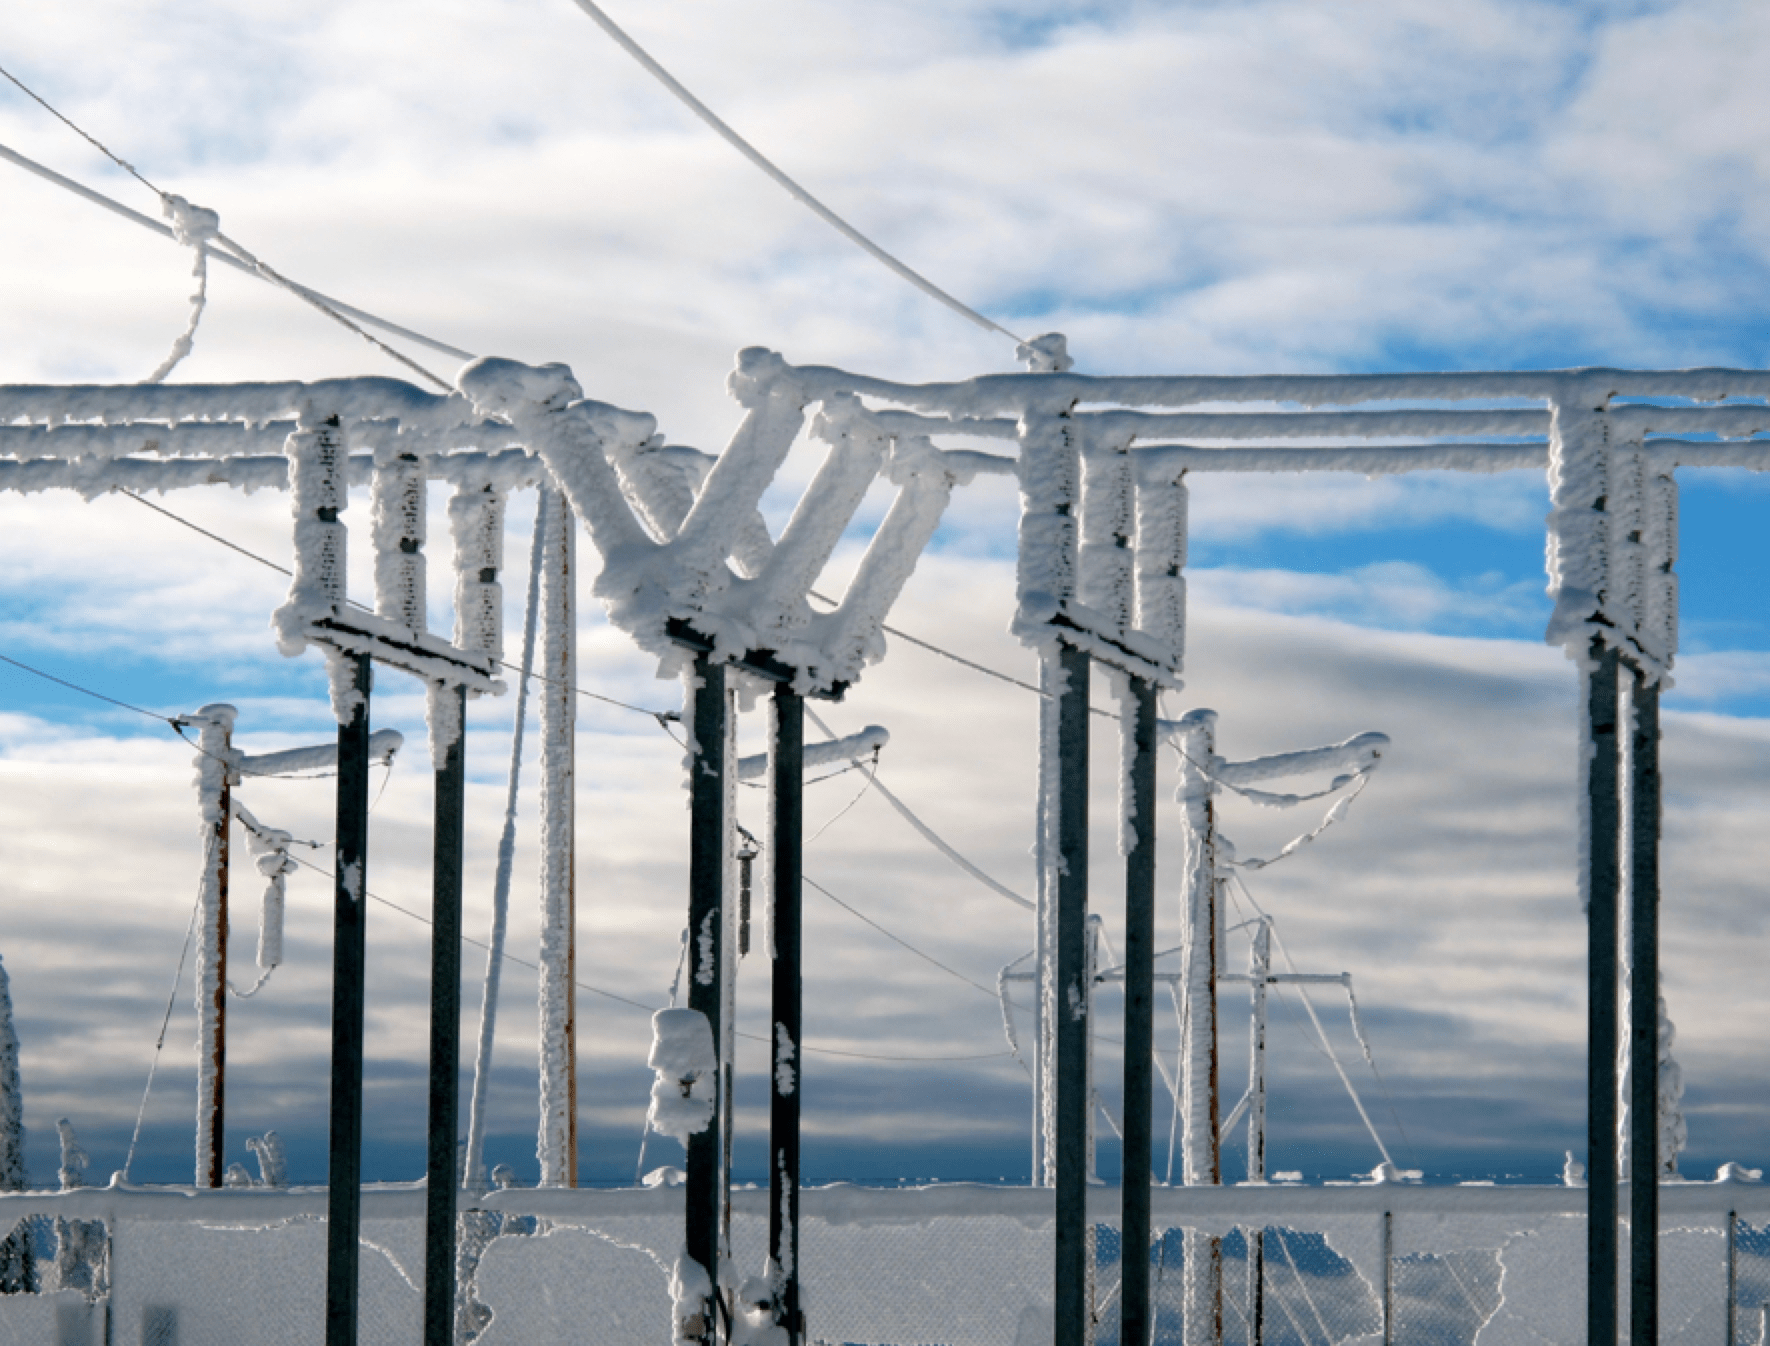
Natural precipitation has electrical conductivity much less than the σW=100 mS/cm used in standard heavy rain and icing tests. On their own, without full bridging, icicles with this conductivity would therefore seem to have little influence on the flashover process for light to moderate icing at any temperature. However, it does not take much surface pollution to increase σW by a factor of as much as 3. Moreover, the process of freeze-thaw partitioning (i.e. purification by crystallization) only serves to eject ions into icicles and drip water.
Refinement of Icing Test Methods
Some utilities still do not fully appreciate that their EHV and HV insulation does not have enough dry arc or leakage distance to withstand moderate ice accretion in combination with even low ESDD. Their exposure to this combination of conditions, e.g. a long cold spell with road salting followed immediately, without intermediate cleaning rain, by freezing precipitation, could occur perhaps once every 30 to 100 years. However, in countries such as Canada, Sweden and China, power system operators have already recognized the risk and supported construction of new EHV testing facilities designed to provide fine temperature control near the melting point. Other countries have re-configured existing environmental test chambers for these same types of investigations.
Convergence & Coordination in IEEE 1783 TM-2009
IEEE Standard 1783TM-2009 was accepted by the IEEE Standards Board in June 2009. This standard adapted some usual high voltage practices, (recently updated in IEEE Standard 4TM-2013), as well as some of the conventions from mechanical testing of switchgear. The key requirement was that any icing test method must reproduce the normal line voltage flashovers that occur when ice, snow or cold fog accumulates on energized, pre-contaminated insulators.
Based on results of laboratory testing and modeling, IEEE Standard 1783TM places emphasis on simulating accretion of ice under normal line voltage. In fact, no test can be regarded as compliant if it does not include this aspect. Icing under line voltage stress in a test laboratory leads to multiple air gaps and partial discharge activity. Icing without voltage stress leads to more uniform ice deposits that, while not representative of actual performance, may still prove helpful in developing empirical and mathematical models. There is far less emphasis on switching or lightning surge performance for icing conditions and this is in line with service experience that such flashovers occur under normal operating voltage.
Future Developments for IEEE 1783 TM-2009
At present, the requirements for DC sources are harmonized with those for clean-fog contamination testing. However, DC source currents levels of 1-2 A for tens of seconds can occur during icing test conditions. These demands may require additional refinements in the specifications. The question about whether a melting phase was absolutely necessary was left open in IEEE Standard 1783TM. Many large as well as small-scale results show that minimum flashover strength as well as ice properties are highly sensitive to ice temperature in the narrow range from -1 to 0°C.
Tests to establish level of ice bridging have played an important role in evaluating mitigation alternatives related to different anti-icing profiles. These tests also contribute to models of the relationship between radial ice accretion thickness on rotating reference conductors, t, and the accumulated weight of ice per cm of dry arc distance, w.
Researchers continue to explore methods to make more efficient use of icing test results. Discussions center on whether it is possible to re-use an ice layer a second time if it is not excessively damaged by a flashover. The possibility of adapting rapid-flashover methods (tried and mainly rejected for clean-fog testing), has also been evaluated. This approach may have more success with icing flashovers having a relative standard deviation or coefficient of variation (COV) of 3% than with contamination flashovers having COV=10%. The relationship between minimum withstand voltage VMW in 5 tests and critical flashover voltage V50 from 10 useful up-and-down results has also been studied. Sharing confidence intervals using the low COV of icing test results is part of this evaluation.
Status of Insulator Selection Criteria for Icing Conditions
Overhead power systems are exposed to a wide range of external threats ranging from low-probability, high-impact events (e.g. meteorites, airplanes) to high-probability, low-impact events (i.e. continuous wind or one lightning flash/ km/year). Reliability problems associated with electrical flashover of insulators under ice and snow conditions tend to fall more into the first category. Nevertheless, while numbers of ice storms in any year is relatively low, they can still lead to numerous flashovers over a 1 to 2 h period on the most critical UHV and EHV lines when HV systems continue to operate normally. As such, the primary function of an icing design guide is to place the risk of flashover into the context of overall line and power system reliability. This could lead to simply accepting risk of icing flashovers in areas of low ice and snow incidence – much as lightning flashovers are accepted on unshielded EHV transmission lines in areas with low flash density.
Convergence & Coordination
Papers by a past CIGRE Working Group set out a hypothesis that the product of ice or snow weight (w) and electrical conductivity (σW) of a particular deposit could be a measure of the combined impact since these factors act to establish the series resistance of the ice layer. This is a dominant term in the mathematical models of icing flashover. Experience with the icing stress product ISP (or snow stress product SSP), supported by improved mathematical models for the flashover process, has led to confidence in mapping test results at a single ISP level (for example w=60 g/cm dry arc distance and σW=100 μS/cm) for a particular insulator to lower or higher levels of accumulation and σW.
Significant voltage drops of up to 15 kV appear across every arc root on the ice surface. This means that the ISP model for a fully bridged insulator might understate actual flashover voltage by as much as 15 kV for every air gap. Indeed, this is the primary motivation for insisting on ice accretion under line voltage stress in the IEEE Standard 1783TM tests. For design purposes, this opens up the possibility of insulator profiles or accessories that deliberately create multiple ice-free zones.
In the cold fog case (as for clean fog), existence of complete, thin ice or frost coating followed by melting and wetting is sufficient to define a threat from ESDD. If thin ice thickness is doubled (say from 0.5 mm to 1 mm), its conductivity is cut in half as a result of dilution.
Statistical methods to select insulator dimensions under contaminated conditions have been described in CIGRE Technical Brochure 158 with additional modeling of raw data and software development. Deterministic and probabilistic methods for selecting insulator dimensions in ice and snow conditions have also been compared.
Standardization: IEEE PAR 1820
The tasks involved in standardizing insulator selection for icing conditions in IEEE Standard Project Authorization Record (PAR) 1820 were broken down as follows:
• Modeling pollution, ice or snow thickness and conductivity making use of site-specific log normal distributions that may have variable median values but which may have common values of log standard deviation;
• Tabulating observed relationships between ice accumulation on horizontal reference conductors and ice accumulation (gm/m of dry arc distance) on vertical insulators; and
• Selecting appropriate risk levels, considering the number of exposed insulators in parallel.
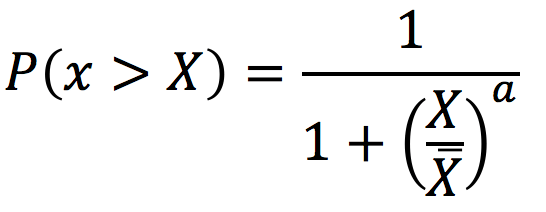
Indeed, many such natural phenomena are evaluated with simple statistical models. For example, lightning protection calculations evaluate the probability of occurrence of a threat current that just causes a back-flashover across the insulation of a tower, given its footing impedance and other parameters. Probability models include log-normal as well as log-logistic, which is closely related in the range of 1 to 99%. The log-logistic probability is simply:
where x̄ is the median value of the variable x and a is an exponent, related to the standard deviation of the natural logarithm of x values by σln x@1.71/a for a<4. Adoption of log-logistic functions has been pervasive in IEEE Icing Task Force papers and also in reference books. The log-logistic model can be adapted to replace Weibull and other distributions with equal fidelity by choosing suitable exponent values. The simple expression can be readily inverted to obtain the value of x that corresponds to the desired level of risk. IEEE P1820 examples show this inversion process in use. A set of 10 probability intervals (from 5% to 95%) is recommended. Some representative median values of NSDD=0.24 mg/cm2 with exponent a=5.5, and median ESDD of 0.14 mg/cm2 with a=2.3 that were fitted to field observations and interpolated are shown in Table 1.

CLICK TO ENLARGE
At present, variables NSDD and ESDD are treated as statistically independent. Still, there are some reports of a fixed relationship, e.g. NSDD:ESDD=10:1 as suggested for North Africa or 5:1 as found in China. However, the scatter in log-log application charts of IEC 60815 is rather large and this trend seems weak. The simplified probability design method is illustrated further using an empirical model for the combined effects of NSDD and ESDD on pollution flashover level. Such a model for suspension disk insulators, for example, was:
A 10×10 table of NSDD and ESDD was constructed and the above equation was used to estimate flashover voltage stress for each pair of values. The calculation was completed by using a probability of flashover of a number of exposed insulators in parallel, along with a Coefficient of Variation (COV)=10%, which is typical in pollution flashover testing.
The example with joint distribution of NSDD and ESDD is provided in IEEE 1820 as a lead-in to the calculation for the icing condition as well as a condition that can also satisfy cold-fog leakage distance requirements. Extension to the icing flashover problem must incorporate 3, rather than 2 independent variables, as follows:
1. The weight of the ice, w, which in the absence of test data is taken as the radial thickness on reference cylinder, t, times a constant times the maximum diameter of the insulator Φ, so that w ≅0.015 x Φ x t. A table provides actual test values of Kw for station posts, polymeric and suspension disc insulators.
2. The conductivity of the applied precipitation, σW. This makes use of another important assumption, which is that freezing rain or snow will have the same statistical distribution as rain during the warm season. Normally there are not enough samples of freezing rain on its own to recommend a mean value or log standard deviation. An exponent of a=2.3 is often found when fitting distributions of precipitation conductivity.
3. The ESDD on the surface prior to the icing event. This depends on the pollution flux and the number of days of exposure. Several different regions have ESDD distributions that can be fitted by a common exponent a=3 in the log-logistic expression.
The additional contribution of ESDD to the value of σW is affected by the icing pattern, which often contacts the top surface area of insulators, on only one side.
A 10x10x10 block of ISP values is formed using the log-logistic distributions of t,σW and ESDD. The effects of ten ESDD values on 10 independent values of σW are summed. The results in the 10×10 table are multiplied by the 10 values of w to get 1000 values of ISP. Probability of flashover makes use of the simple model E50=396 (ISP)-0.19, where E50 is in kV/m dry arc and ISP is in (g/cm x μS/cm), as well as the number of insulators in parallel and the COV of 3%. IEEE Standard Project P1820 assembles and cites some typical resources for establishing the number of days without rain, and number of days with icing, that can be expected in a given region. These climate variables affect the season-peak ESDD and number of exposures per year. In addition, links are being explored to recent developments in the global satellite measurements of pollution, which may be suitable for insulator selection in sparsely populated regions where ESDD and σW are unknown.
Improving Insulator Selection Criteria for Icing
Applicability of ISP to DC Flashover
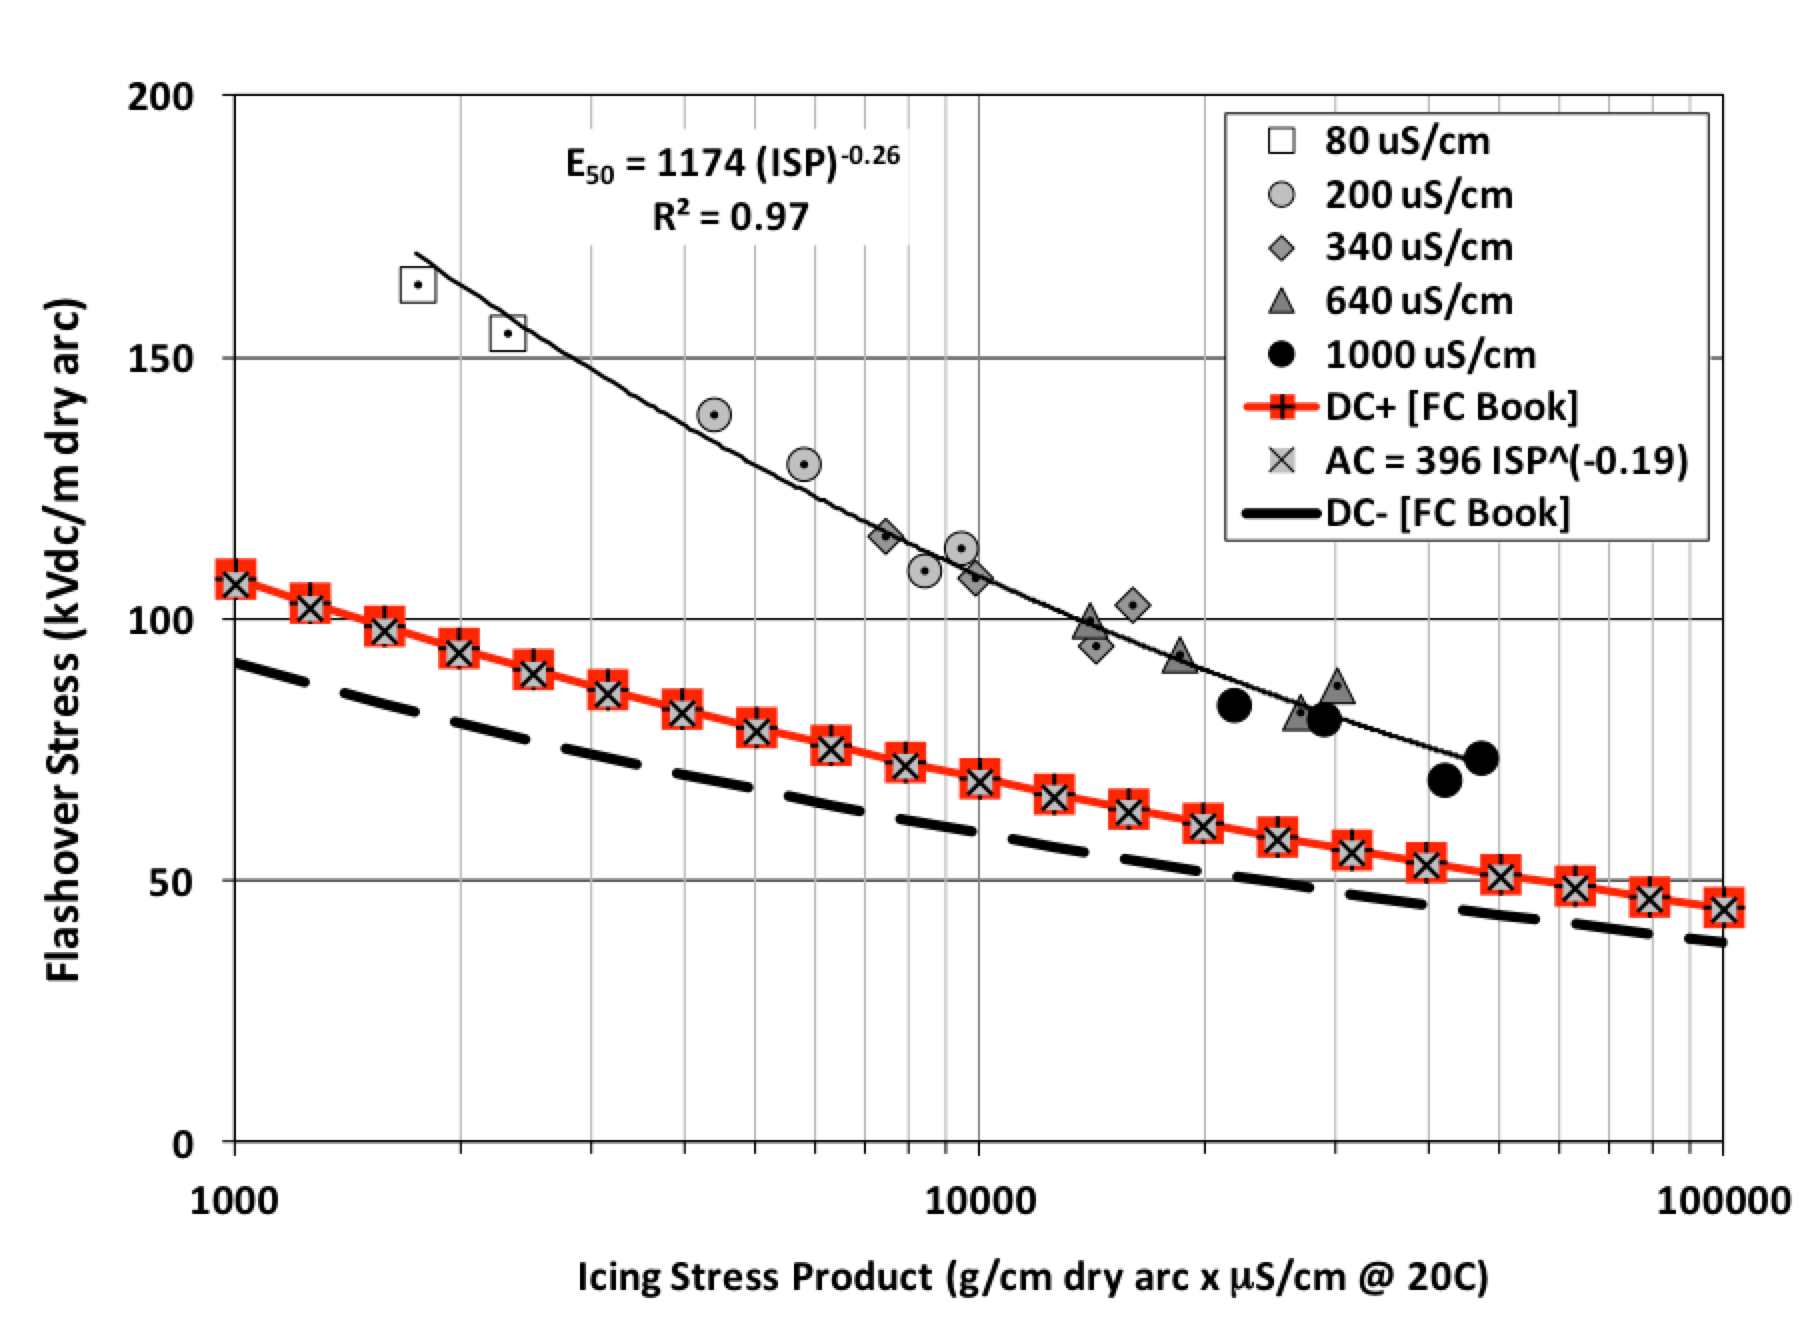
Based on some research results, the ISP model seems ideally suited for DC insulator selection in the range of 80 to 1000 μS/cm for fully bridged suspension insulators. There are still some important differences in DC test methods and results, as shown in Fig. 2.
CLICK TO ENLARGE
The flashover stress for DC positive is about the same as for ac, given by E50=396 (ISP)-0.19 in Fig. 2 for icing tests with a melting phase. The DC negative polarity has lower flashover strength, especially when energized during the icing phase.
Extension to Testing of Externally Gapped Line Arresters (EGLAs)
CLICK TO ENLARGE
The IEC 60099-8 test standard, for electrical and environmental performance of externally gapped line arresters (EGLAs), discusses a test of gap re-ignition when the metal oxide resistor (MOR) component is contaminated and wetted. Recent experience shows ice accretion on the MOR of a 230 kV EGLA plays a similar role. Arcing ignition and extinction in the air gap followed theoretical models closely.
Role of Insulator Profile for Light to Moderate Ice Accretion
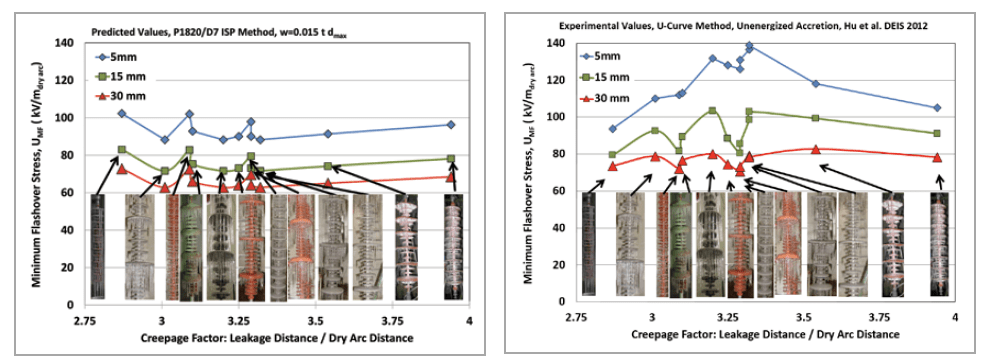
The transition from cold-fog flashovers across leakage distance, to icing flashovers across dry arc distance, was well illustrated by a recent series of icing tests on polymeric insulators having different profiles. Insulators with creepage factor (leakage distance divided by dry arc distance) in the range of 3<CF<4 were tested with light, medium and heavy ice thickness. For 5 mm of accretion on a rotating horizontal reference cylinder, typically giving w=10 g/cm on polymeric insulators with alternate profiles, there was a strong effect of the creepage factor CF. For 30 mm of accretion, w=60 g/cm, there was no influence of CF on flashover performance.
In the IEEE 1820/D7, when a relation has not been established between ice weight, w, on an insulator profile (g/cm dry arc) and thickness, t, on a rotating reference cylinder (mm), a recommended estimate is w = 0.015 × Φ × t where Φ (mm) is the maximum shed diameter of the profile. From Fig. 3 this means that profiles with larger shed diameter should accumulate more ice and thus have reduced flashover strength in the ISP model. The upper figure of predicted values suggests that the effect is minor and that most insulators should have about 90 kV/m dry arc strength when t=5 mm.
Test results shown below the graph of ISP predictions in Fig. 3 highlight some weakness with this approach. With only 5 mm of ice accretion, most polymeric insulator profiles were not fully bridged and there was a strong effect of creepage factor in the experimental results. It is recognized in IEC 60815 as well as in insulator application guides that a creepage factor (leakage to dry arc distance ratio) of 3<CF< 3.5 is best and the shed efficiency factor for CF >4 is reduced. The same experience seems to be true, so far, for insulator profiles under icing conditions.
The effect of polymeric insulator shed profile on DC flashover performance has also been studied. Sheltering of large-diameter sheds in alternating profiles may play an important role in the range of ice accretion from t=10 mm to t=20 mm. The use of V strings is also helpful, as these are more difficult to bridge with ice too.
CLICK TO ENLARGE
Utility Performance Expectations
There has been considerable progress on the technical aspects of Draft 7 of P1820 that was circulated to IEEE Icing Task Force Members for technical review several years ago. However, comments from utilities have not helped to define reasonable performance expectations. Dry arc distance requirements to achieve an icing flashover rate similar to lightning trip-out rates (i.e. on the order of 1 outage/100 km/year) may be onerous. For example, the 77 kV/m stress level in IEEE Standard 1862 would give good UHV icing performance but calls for a vertical dry arc distance of 8.3 meters. A design goal of allowing one hour of icing flashovers per 10 years may be more realistic, especially if utilities can recognize icing problems are occurring and have the operational flexibility to simply de-energize affected lines and stations to prevent equipment damage. Greater utility participation through IEEE DEIS or PES is needed to close this loop
Conclusions
Utilities experienced multiple flashovers on EHV and UHV station and line insulators over the 1980s and 90s during periods of ice and snow accretion.
Based on this, the decade from 2000 to 2009 saw evolution of icing test methods that are representative, repeatable, reproducible and cost effective in order to best meet utility needs for problem diagnosis and selection of remedial actions. Design standards can exploit simple probabilistic methods for selecting appropriate dry arc distances for heavy ice and snow conditions. Designers can adapt methods for selecting appropriate insulator leakage distance by recognizing that peak annual ESDD and effectively extreme NSDD values may occur most often in the winter coldfog conditions.

