Heavy snow over the Italian Dolomites in late 2013 left tourists enduring an extended blackout in one of Europe’s most exclusive winter resorts. Then, in spring 2015, central Italy was hit by a major storm with over a meter of snow combined with strong winds that left over 200,000 customers without power for hours. The situation was even more critical at the start of 2017 during three days of ‘the perfect wet-snowstorm’ that affected more than 400,000 customers across different provinces. Nor has extreme snow been the only weather event causing headaches for network operators. Heavy rain in Rome in November 2013 caused flooding of substations while extreme winds and tornados damaged extended sections of lines in Trezzo d’Adda and Tuscany. Later, prolonged heat waves overloaded distribution systems and caused cable joints to fail.
Such increasingly frequent weather extremes, in Italy and indeed across the globe raise the question of how best to deal with events that severely impact energy systems. Michele de Nigris of Ricerca sul Sistema Energetico (RSE) in Milan explains how overhead lines and substations may have to be redesigned, reinforced or made more resilient to take extreme climate into account. He also examines the inverse: namely how power lines themselves are changing local environments. Approaches are proposed to assess impact of energy infrastructure in a lifecycle philosophy while also engaging stakeholders in decisions about technologies and routing of lines.
Climate Change & Power Systems
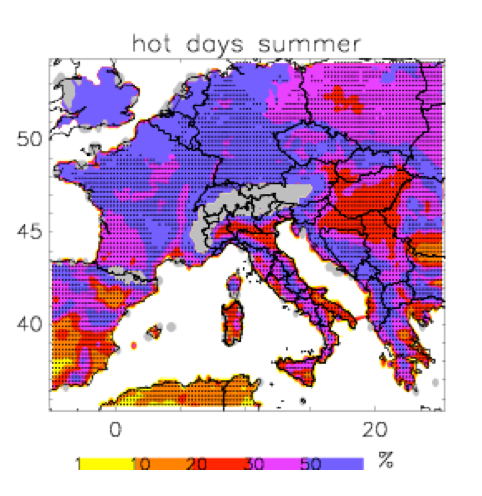
The Mediterranean has an especially high exposure to the impact of climate change since it is located in the transition zone between arid North Africa and rainy, temperate Europe. This location amplifies natural variations and enhances the impact of extreme weather events that threaten power infrastructure. Estimating climate change and its interaction with power systems has been done using Regional Climate Models (RCMs) that evaluate these phenomena with suitable spatial resolution, relying on meshes that range from 25 km down to 12 km. The ability of RCMs to accurately describe current climatology is verified using different data sets based on observations (e.g. E-OBS or ERA-Interim). For example, RSE carried out an estimate of expected evolution in climate in Italy over the period 2021 to 2050 using numerical models whose accuracy was verified by checking how well these describe climate over the past decades. Projections from these models reveal that the entire Mediterranean region is expected to experience a temperature increase during all seasons of at least 1 to 1.5°C, with the greatest increase being during summer (about 2 to 2.5°C) and concentrated inland and in southern areas. Warming of about 1.5°C is also expected in Alpine regions during winter. The average warming expected to take place during summer will then lead to a significant increase in extremely hot days and tropical nights, particularly in the Po Valley and southern Italy (see Fig. 1). Consequences will be felt not only on electrical line loading through increased use of air conditioners but also as higher thermal stresses placed on cables due to drying terrain that will have reduced heat exchange capability. Projected increases in minimum temperatures will also see reduction in snow cover and substantial melting of glaciers in the Alps.
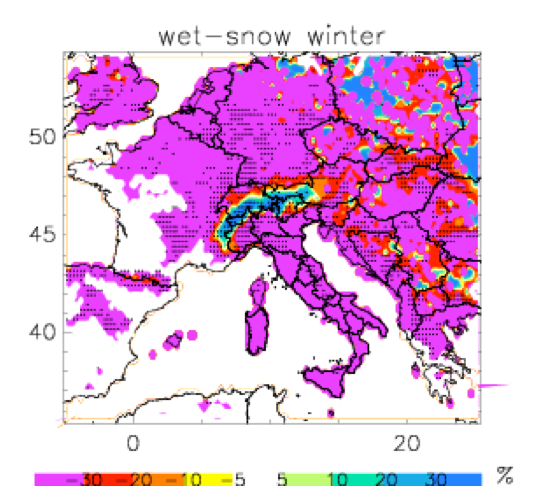
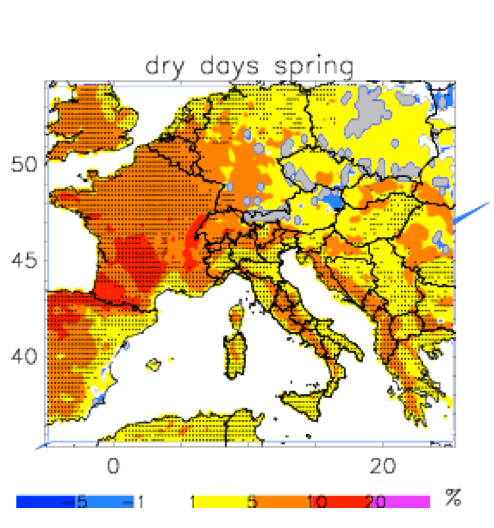
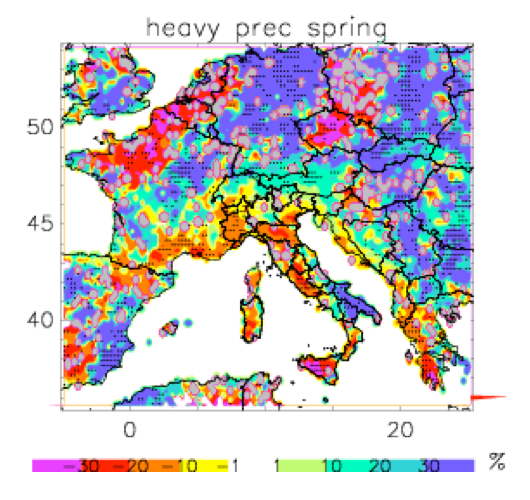
Winter precipitation combined with relatively high temperature is the classic condition that triggers ‘wet-snow events’: in fact, precipitation rates higher than 10 mm/day and 0°C< Tmax <1.5°C (as in Fig. 2) are expected to increase by 30 to 40% by 2050. The number of dry days, i.e. with precipitation values less than 1 mm/d, is expected to increase as well, mostly during summer, with special reference to southern Italy (see Fig. 3). In terms of heavy precipitation events (i.e. where rainfall is greater than 20 mm/day), central and northern areas of Europe in winter and south-eastern coastal sites during spring will experience increases of up to 30% (see Fig. 4). The situation will become even more severe in the eastern Italian Peninsula during autumn.
Dealing with Climate Change
Projections such as this about climate change indicate that power systems will be exposed to ever-increasing threats that have the potential to jeopardize continuity and quality of supply. This leads to the question: how best to deal with heightened risk? Must entire power systems be reinforced to deal with increased stress levels that were not considered during the design phase? And is the conventional process of system planning and operation based on the concept of reliability still sufficient? Or will there be a need to change approach to the broader concept of resilience? Such a conceptual transition is not trivial and requires elaboration: design and operation of a reliable power system implies availability of adequate infrastructure operating under given security rules. In this context, margins are given to a system that has been dimensioned and designed to operate without failures under given thermal, electrical, environmental and mechanical stresses experienced over its lifetime. In situations where stresses exceed design values or when wear degrades performance, the typical requirement placed on components is that they must fail safely while on the system. The N-1 approach is normally adopted, i.e. the power system must function properly even if a major component fails. But stresses linked with climate change will likely generate situations well beyond N-1 conditions, affecting large portions of a network at one time and causing multiple contingencies that could lead to extended blackouts. The concept of resilience envisages the possibility of a degraded condition and occurrence of multiple failures but considers the capability of the system to rapidly return to a normal, stable operating condition once the severe event that triggered failures has passed.
CLICK TO ENLARGE
CLICK TO ENLARGE
CLICK TO ENLARGE
CLICK TO ENLARGE
The mathematical formulation for resilience is highly complex and a separate topic on its own. The focus here will therefore be rather on the basic recipe for resilience. This is comprised of two main elements: the degraded component and the restorative component, related respectively to progress of the disturbance and recovery post-disturbance. The first aspect is linked with threats, vulnerabilities, contingencies and consequences:
• Threats are the menaces to electrical components and systems. These can be external or internal, natural or human-caused, accidental or intentional, etc. Also among these are extreme environmental conditions, actions of hackers and terrorists and also progressive wear and ageing of insulation;
• Vulnerabilities are any weaknesses in the components and systems, thereby impairing their robustness and favouring malfunction and faults. These also represent various limits of operation, e.g. flashover voltage of polluted insulators, mechanical strain on conductors, seismic performance of circuit breakers, etc. Vulnerabilities can be reduced using screens, protections, redundancy, network configuration, etc.;
• Contingencies are the combination of threats and vulnerabilities. They represent the event of malfunction of components and systems and can be single (i.e. compliant with the N-1 approach) or multiple, such as when failure of one component propagates to others. Examples include explosion of a current transformer in an air-insulated substation or cascade tripping of lines under extended pollution events;
• Consequences are the impacts of contingencies. In an electric power system, these are often brought back to the amount of energy not supplied to customers (ENS).
The restorative component of resilience expresses the capability of a system to partially or to fully recover performance. To evaluate this component, there is the need to quantify the actions required to restore power to users, even under unavailability of network infrastructure (reboot), as well as the actions needed to repair damaged infrastructure (recovery). Examples of reboot might be clearing roads blocked by snow to access distribution substations or transitory connection of auxiliary power units to supply critical loads. To increase resilience, each of its various components must be considered: anticipating threats originating from external (forecasting) or internal (monitoring and diagnostics) conditions to adopt proactive corrective measures; reducing vulnerabilities through screening, protection, strengthening; limiting contingencies by means of enhanced network meshing; and limiting consequences through rapid re-closers, etc.
Wet Snow Affecting Line Conductors & Ground Wire
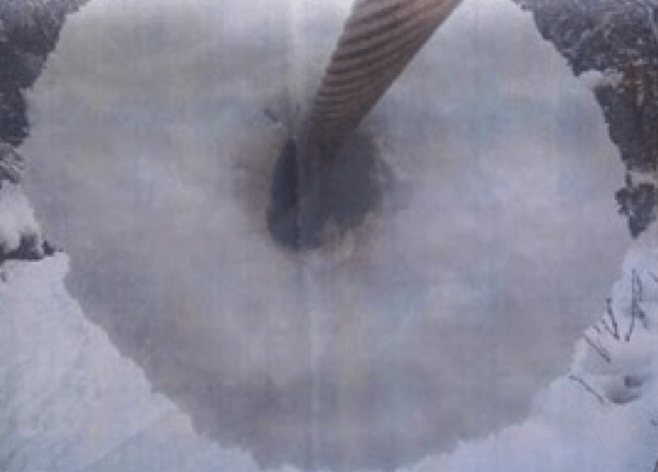
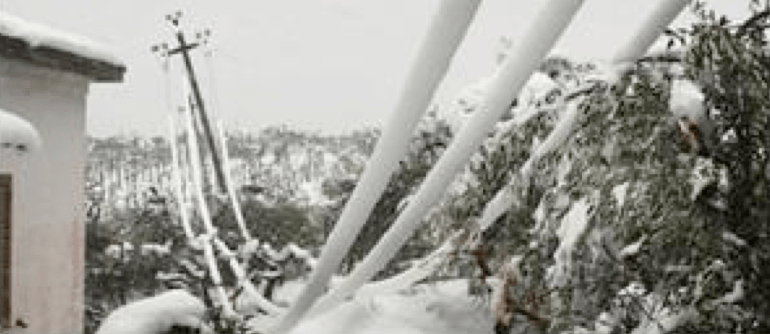
Among the threats that impact overhead lines, perhaps the most critical is ‘wet snow’. Wet snowfalls are characterized by snowflakes with high liquid water content (LWC) that adhere easily to the external surface of conductors and ground wires. This phenomenon develops under air temperatures in the 0°C to 2°C range and an LWC greater than 30% of total snow mass. When precipitation rate exceeds 2 to 3 mm/h, an initial layer is deposited onto the external surface of the conductor. This constitutes the foundation over which a snow sleeve builds up. The phenomenon is often initially asymmetrical, since snow accumulates more on the side exposed to wind. This shifts the centre of gravity and generates progressive conductor rotation around its axis. The rotation process is the root cause of the cylindrical shape of sleeves, whose densities range from 150 to 500 kg/m3. When ambient temperature falls below 0°C, sleeves freeze and becomes highly compact (e.g. Fig. 5).
If snow accumulation generates mechanical loads exceeding the tensile strength of the conductor and causing mechanical strain, the combined effect under wind worsens the situation, often collapsing lattice towers and/or jeopardizing ground clearances. Moreover, abrupt detachment of a sleeve can result in violent rebound of conductors as well as ground wire, causing a permanent line trip. Although these types of events cannot be avoided, efforts can nevertheless be made to predict their occurrence in order to limit resulting contingencies and mitigate consequences. In Italy, for example, such an integrated monitoring and alert system, named WOLF (Wet snow Overload aLert and Forecasting), is already in place.
CLICK TO ENLARGE
CLICK TO ENLARGE
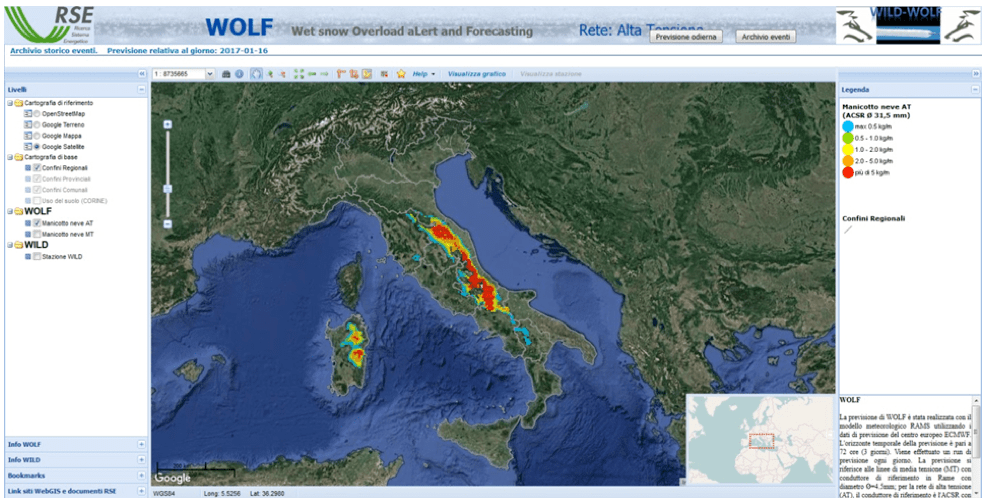
WOLF, developed over a GIS platform, provides a wet snow forecast covering the next 72 hours. It also calculates the associated potential mechanical load and estimates the anti-icing current (i.e. level of current in the conductors that would avoid formation of the sleeve due to heating caused by Joule losses), thus supporting operators in adopting active mitigation strategies. In this forecast system, shown in Fig. 7, each pixel in the screenshot depicts the mechanical load predicted by WOLF for each linear meter of conductor, with a resolution of mesh having 5 x 5 km sides. Specific reference is made to the typical two conductors used on Italian HV and MV networks, i.e. 31.5 mm and 4.5 mm diameter respectively, although other configurations can be implemented. By clicking each coloured dot, the user can open a summary chart that contains the main variables involved in sleeve formation, e.g. air temperature, wind speed, hourly equivalent precipitation, cumulative precipitation relevant to the current event, incremental ice load as well as the anti-icing current (AIC) curve.
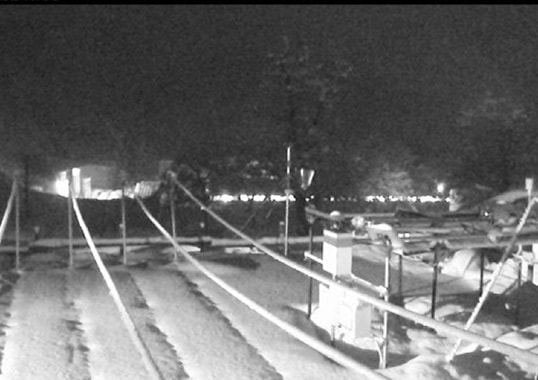
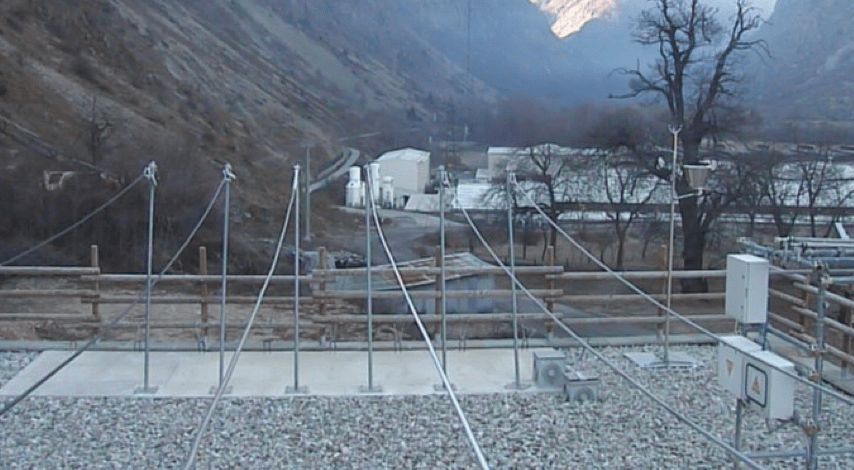
In synergy with WOLF, an automatic test station named WILD (Wet Snow Ice Laboratory Detection) has been deployed in Vinadio in the Western Alps. Located at an altitude of 950 m, this facility allows validation of the forecast system, fine tuning parameters in the mathematical models of sleeve accretion, computation of AIC curves and also assessment of the relative effectiveness of different mitigation measures. The site includes 7 spans of about 14 m each to perform qualitative comparative tests of different types of conductors exposed to the same environmental conditions. Starting from the left, in Fig. 8, the first two conductors have been treated with black varnish – the first an ACSR-Z Ø19.04 mm conductor and the second a low-sag type TACIR Ø18.99 mm conductor. At the centre are two untreated conductors, respectively ACCC Ø24 mm and ACSR Ø22 mm. The remaining two conductors are ACSR-Z Ø19.04 mm with different hydrophobic coatings. The station is also equipped with two additional spans of ACSR conductors, with 3 m length, mounted on a system that forces them into a slow rotation, according to ISO 12494. These spans are equipped with load cells and ultrasonic sensors to measure mechanical load and thickness of the snow sleeve respectively. The rotation is able to represent conductor torsion and movement at the centre of the span in an actual overhead line. This allows capturing the total flow of snowfall over the conductor and is useful in validating the theoretical accretion model, which might otherwise assume a conservatively high growth rate.
CLICK TO ENLARGE
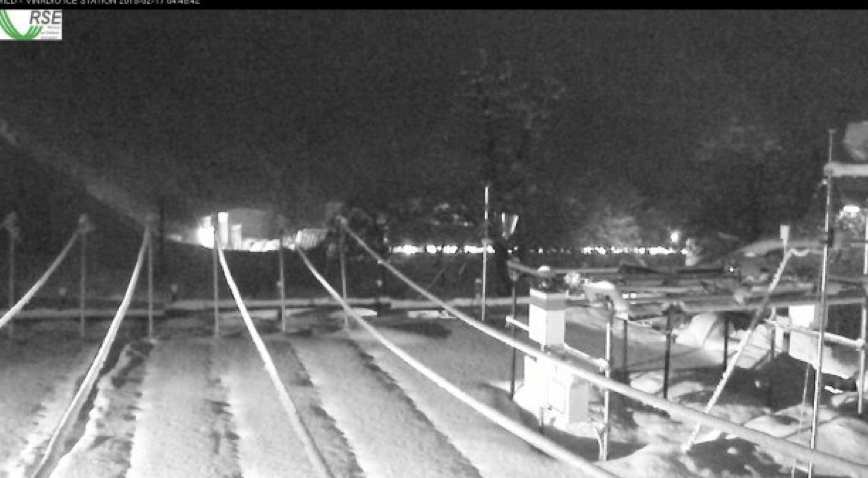
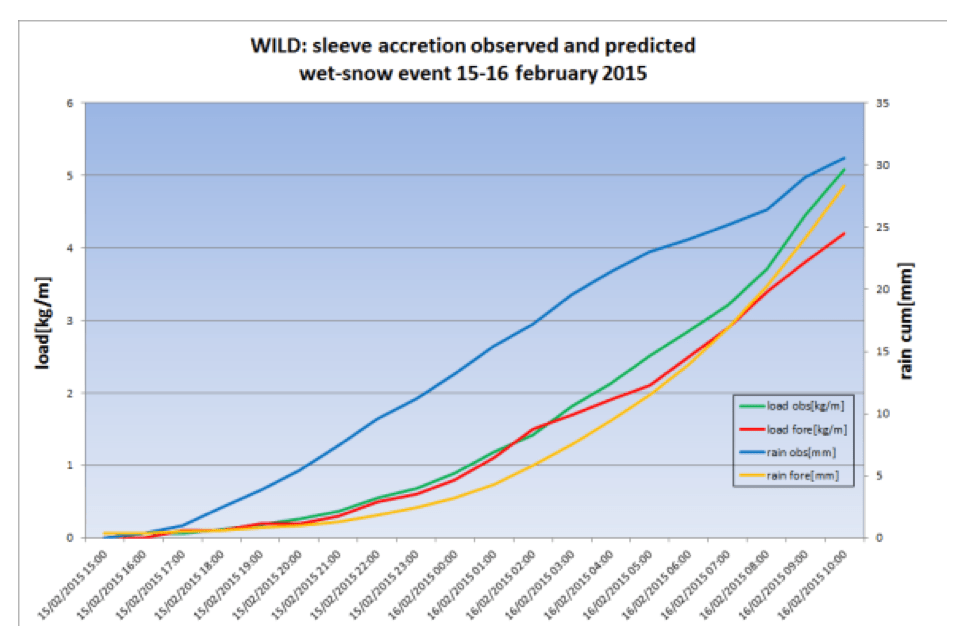
The mathematical model for ice-accretion is based on the equation from the ISO standard for icing of structures and where all empirical parameters are adjusted based on a self-learning process founded on experimental observations from Vinadio. Fig. 9, for example, is an image captured by webcam at the end of a snowfall that occurred on Feb. 15-16, 2015. Snow formation can be seen on all spans, including on the hydrophobic-coated conductor, thus demonstrating the ineffectiveness of its formulation. Load measured on the ACSR conductor was 5 kg/m and thickness of the sleeve was 11 cm. Fig. 10 provides results of the simulation of that specific event, showing that the wet-snow load expected on that conductor was 4.2 kg/m, thereby confirming model accuracy.
CLICK TO ENLARGE
Snowfalls are unavoidable and projections of climate change indicate that the Italian region, for example, will potentially be subject to more severe such events in years to come. This presents a dilemma for network operators, i.e. either increasing mechanical strength of lines – including conductors, ground wires, poles and insulators – to withstand increased wet snowfall loads or using mitigation measures to limit impact of such events, i.e. adopting a resilience approach. Mitigation measures for wet snow are multi-faceted. In terms of impact for any user, the first measure can be achieved during line planning by taking into consideration the effects of climate change, i.e. taking into account evolution in thermal, electrical, mechanical and environmental stresses in light of the most critical events expected in that region. When the return period of heavy snowfall is shorter than the lifespan of a line, or shorter than the time considered as acceptable for any major supply interruptions in a risk analysis, several measures can be adopted:
• using underground cables;
• increasing transmission system meshing and back-supply capabilities (thereby avoiding supplying substations using lines in an ‘antenna configuration’);
• using physical means to avoid or limit accretion of snow sleeves, such as hydrophobic or ice-phobic surface treatments or coating conductors;
• applying anti-rotation devices (e.g. pendulum de-tuners, wind dampers, torsional damper de-tuners);
• installing interphase spacers, as used to reduce conductor galloping;
• increasing surface temperature of conductors to avoid sleeve build up by means of circulation of some minimum anti icing current.
CLICK TO ENLARGE
CLICK TO ENLARGE
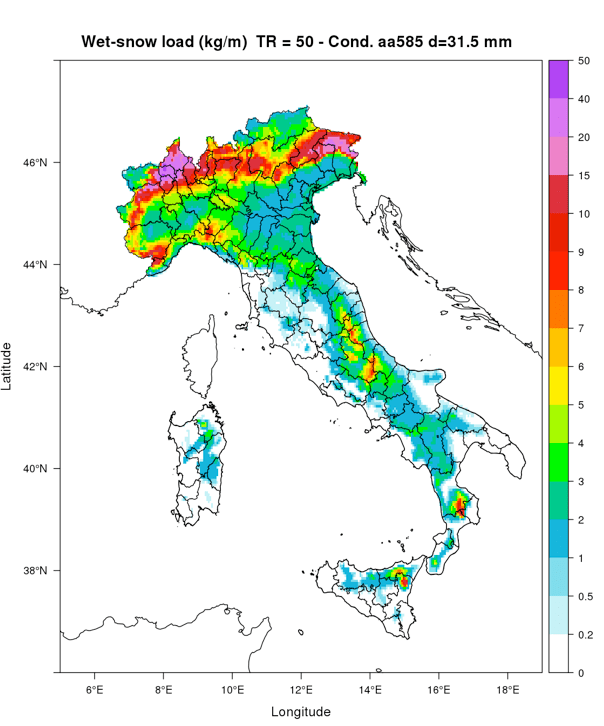
Mechanical dimensioning of overhead lines is currently carried out following requirements of the European standard EN 50341-1 “AC Overhead lines having rated voltage of 45 kV and above” first published in 2001 and integrated by National Normative Aspects (NNA) to take into account the specific situation in Italy. Among others, this standard prescribes that dimensioning of lines be carried out using a risk-based approach that should take into account actual local climatic conditions as well as ice and wet snow mechanical loads having a return period of 50 years. The dimensioning standard has been updated and amended several times since initial publication. Several editions of EN 50341 were published as well as of NNAs (the last being EN 50431 2 13:01 2017). It is intended that the requirements of the standard be used for new lines and for important overhauls to existing infrastructure, whereas most of the transmission system in Italy still complies with the previous CEI 11 4:1998. The risk-based approach requires understanding occurrence of events. This is why continuous update of the map of events is essential, especially for situations where local extreme weather conditions influence overall statistics. In the specific case of wet snowfall, the most recent map produced by RSE, shown in Fig. 11, considers the months from November to April, maximum duration of snow sleeve accretion of 48h, maximum possible load of 50 kg/m and temperature range of -2°C < Tavg < +2°C.
CLICK TO ENLARGE
Among the most effective mitigation measures to limit or avoid a snow sleeve is anti icing current. Evaluation of AIC has been implemented in WOLF and validated at WILD. The thermal model proposed by Shurig and Frick is used to estimate the AIC necessary to maintain the conductor at a skin temperature of 1.5°C to keep it free from snow accretion. In light of the positive validation of the model and its continuous refinement using self-learning based on observations at Vinadio, AIC is systematically computed and reported for each pixel in the WOLF GIS considering all types of HV and MV overhead conductors and cables used in Italy.
In regard to impact on required mechanical characteristics of line insulators, wet snow can generate substantial increase in apparent weight seen by insulators on exposed lines. But is this a real threat for insulators? Dimensioning the mechanical ratings of insulators when equipping a line is generally founded on the most critical case, i.e. strain insulators. The tension that a strain insulator must accommodate varies continuously with conductor weight and temperature, wind load as well as snow and ice build-up and is influenced by specific stringing criteria. Mechanical dimensioning of insulators, e.g. required Mechanical Failing Load (MFL) is such that strain insulators must withstand all loads and adequate safety margins, even during worst cases conditions. Safety factors between maximum foreseeable load and minimum required MFL normally range between 2.5 to 5. Typical values range from 70 to 150 kN for 150 kV and from 120 to 360 kN for 380 kV lines. Straight and angle suspension insulators are normally selected with ratings similar to strain insulators, for uniformity along the line. The composition of forces on suspension insulators is such that the equivalent mechanical load they are subjected to is typically 4 to 5 times lower than for strain insulators. During a heavy wet-snowfall event the most critical portion of a line is represented by lattice towers with suspension insulators since these are dimensioned with the least stringent mechanical requirements. The safety factors adopted for suspension insulators are therefore much higher than for the towers themselves. Increased threat level due to wet snowfalls will therefore not directly affect insulators.
Mitigation measures, as discussed, must be taken for towers and conductors and different line and system management policies undertaken to avoid or limit line damage and its consequences. Snow sleeves can in some cases be limited or even avoided on conductors using anti-icing current to increase conductor temperature above some threshold value. In those situations where current flows cannot be directed, another possible mitigation measure consists of avoiding rotation of the conductor, thus preventing sleeve build-up. Pendulum de-tuners can be used for this purpose. Although applied mainly to avoid conductor galloping, these devices are tightly clamped onto conductors and increase their torsional behaviour. When such a measure is not applicable, interphase spacers can prove helpful given their duplicate function of clamping conductors and ensuring their correct mutual position. Dimensioning these devices must follow the same rules as for interphase insulation.
Storms
In the case of Italy, violent, thermal atmospheric contrasts typically occur over the northern flats and coastlines. These situations generate intense localized storms characterized by extreme lightning activity, whirlwinds and even tornados and therefore can directly or indirectly impact power systems. Lightning induced overvoltages are normally kept under control by ground wires, insulator spark gaps and surge arresters. The effect of winds, heavy rain and hail can have a more serious impact, such as branches, signs and rooftops striking and damaging conductors and causing short circuits, or flooding substations. A whirlwind builds up within a storm super cell and can cause extreme localized damage.
CLICK TO ENLARGE
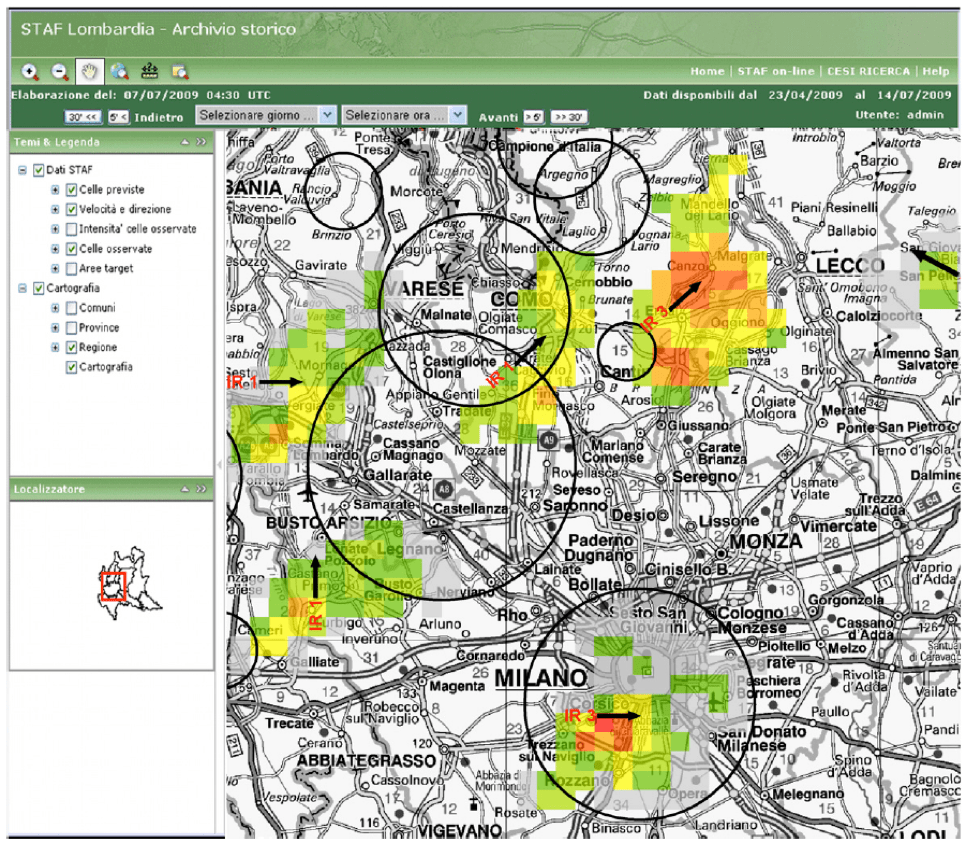
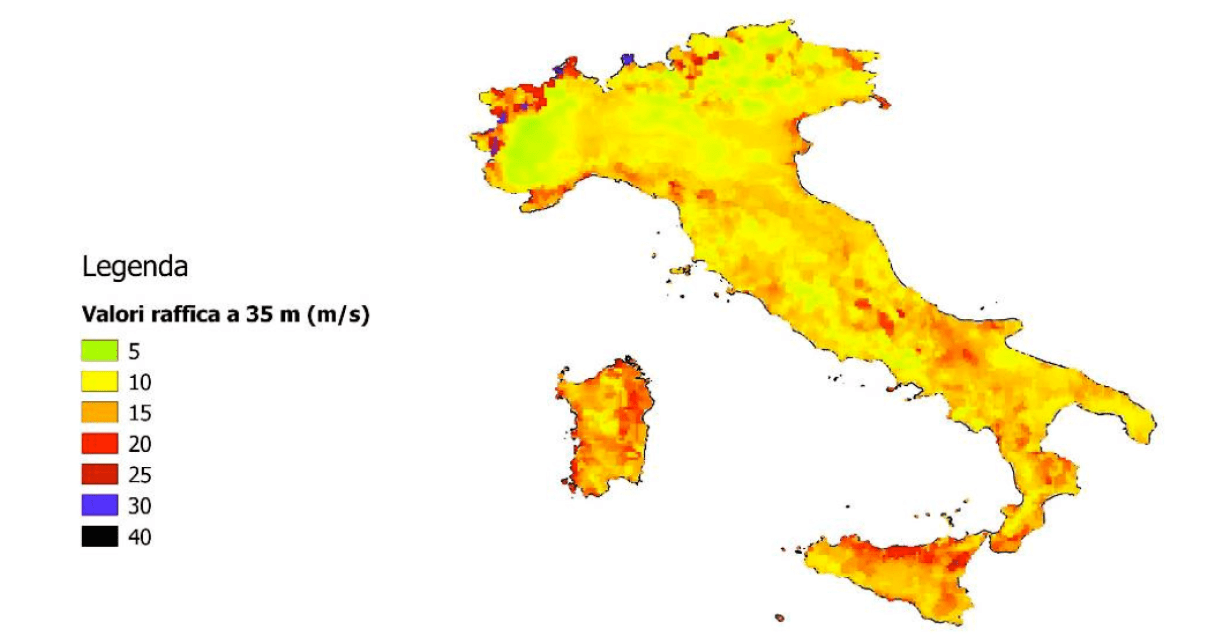
Once again, a resilience approach can be envisaged with the goal of reducing the consequences of such contingencies. For example, a well-designed alert system can be useful in preventing injuries while precisely locating the event can reduce the time for repair crews to arrive. But forecasting such events is difficult since meteorological stations on the ground are not sufficient and only monitor wind or precipitation. On the other hand, ground-based C-band radar and the Meteosat satellite are able to forecast the intensity and position of a thunderstorm less than an hour in advance of the event. STAF (Storm Track Alert and Forecast), a ‘nowcasting’ system based on radar and Meteosat Second Generation data has been set up and selects only severe thunderstorms, tracks them and sends alert messages to users. STAF calculates the probability of damage from a thunderstorm based on a series of parameters derived from radar and satellite observations, with special reference to reflectivity of the cumulonimbus along the vertical axis. The method has been calibrated through re-analysis of events. For example, 359 such events have been analysed using information reported by local newspapers. An example of using STAF over the city of Milan is shown in Fig. 12. Re-analysis of the period from April to July 2009 identified 6 events as well as their development and direction over time. Analysing whirlwinds and tornados can be carried out using a high-resolution non-hydrostatic meteorological model, such as RAMS, complemented by another high-resolution model, WRF. Special attention is given to situations characterized by extreme baric gradients that are able to trigger wind gusts, whirlwinds and downbursts that threaten power lines. For this reason, the focus is on events occurring 35 m above ground level. Meteorological prediction models are not suitable for such analysis and ‘nowcasting’ systems based on radar and satellites are preferred.
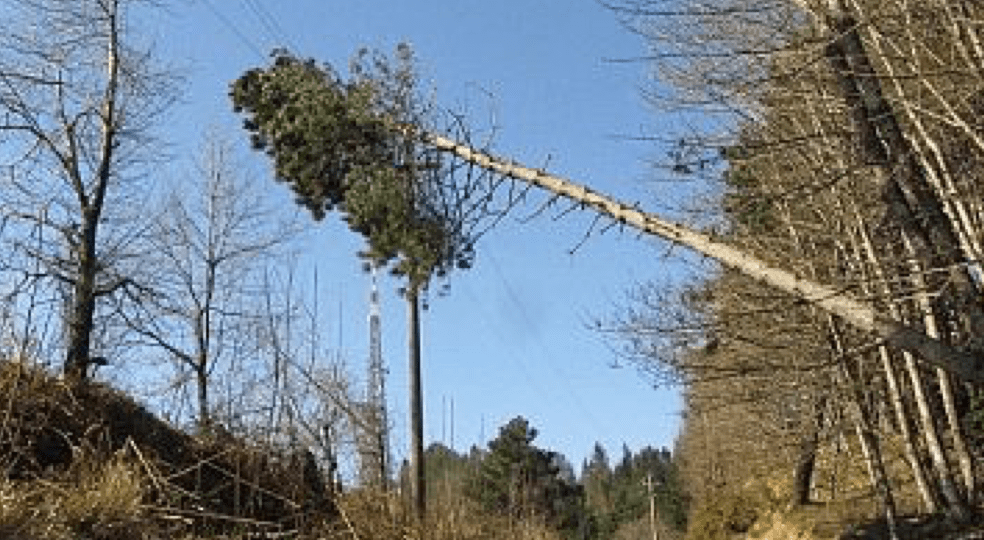
Statistical analysis carried out on each pixel of the RAMS model, having spatial resolution of 0.065°, allows determining the Probability Density Function (PDF) of wind gusts over an entire territory and reporting, on a country-wide map (Fig. 13), the level of wind gusts having a probability as low as 0.1% of exceeding that threshold (i.e. with 99.9% percentile). A tornado, for example, occurred in Tuscany on March 5, 2015. Wind speeds of 210 km/h were recorded and more than 200,000 users were involved in an extended blackout that lasted several hours. Structural damage was estimated in the tens of millions Euros. EHV lines were damaged by the impact with detached metal roofs and trees falling across line corridors (Fig. 14).
CLICK TO ENLARGE
CLICK TO ENLARGE
As for impact on electrical insulation, service experience from AC systems indicates that rain is not a particularly severe environmental stressor for line insulators. In fact, higher impact severity has been reported for insulators at substations, especially when these have been designed with small spacing between sheds. Test regimens included in present standards are normally adequate to verify design of external insulation under rain conditions. Heavy rain tests might be recommended, however, in extreme conditions, e.g. rainfall rate of 10 mm/minute and water conductivity of 1000 μS/cm. Since reduction in performance due to heavy rain is most pronounced for insulators having small distance between sheds, mitigation measures include adopting insulators having shed spacing greater than 60 mm, or application of ‘water cut’ or booster sheds.
Pollution Events
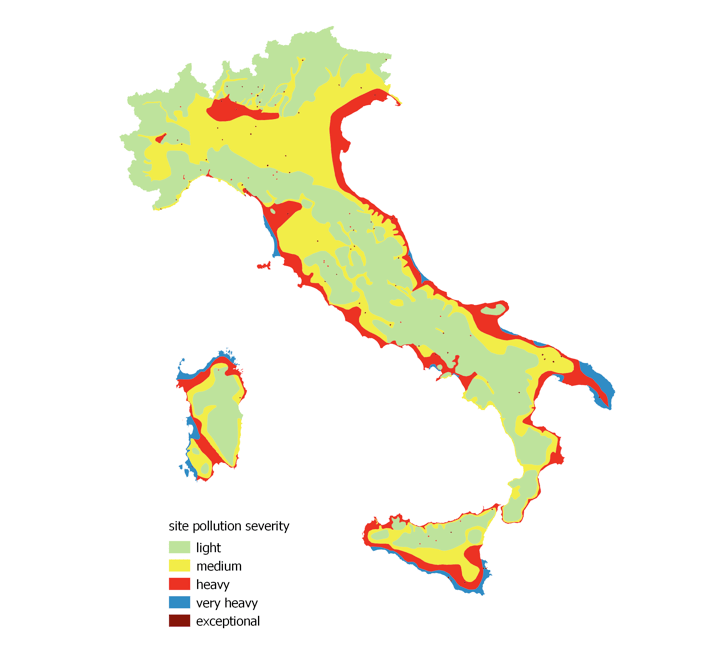
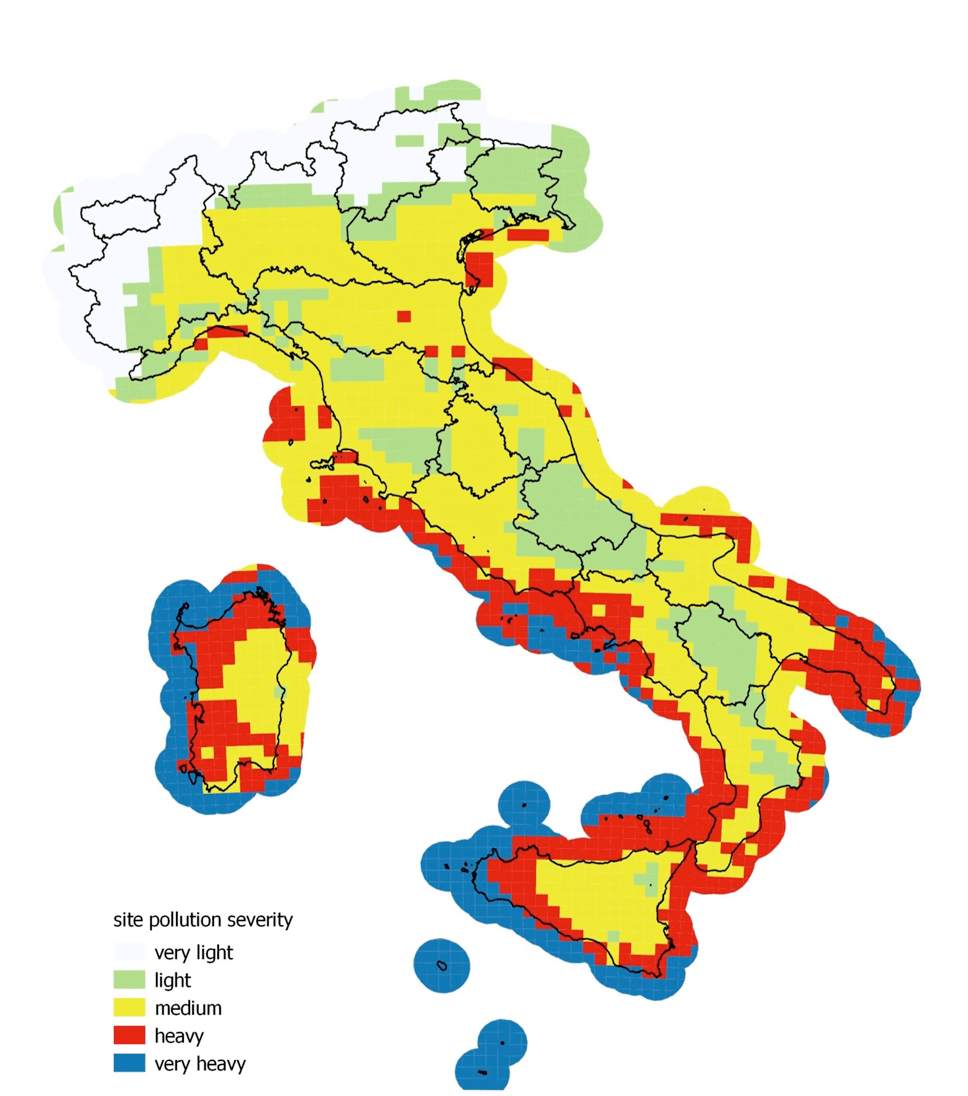
Environmental pollution and its impact on reliability of power system insulation is a known threat. Surface contamination due to salt deposits or other pollutants can, under certain circumstances, cause flashover of line and substation insulators, resulting in contingencies. A good example was the blackout that affected all of Sardinia on Sept. 21-22, 2001. An extended pollution event was the origin of a series of cascade contingencies that tripped most of the island’s transmission lines, the Sardinia-Italy HVDC cable link and more than 550 MW of local thermal generation. Local population, industry and the service sector were all left without power for more than 10 hours. Research to assess, monitor, prevent and correct such situations resulted in the latest version of AMICO (Artificially Moistened Insulator for Cleaning Organization) – a device able to measure site pollution severity, even in DC. The information and knowledge acquired relies on laboratory tests on insulators removed from service as well as on extensive mathematical modelling. The goal of this activity has been twofold: to update national pollution maps that are important for planning development of the power system as well as dictate performance and characteristics required of insulation at different locations; and, second, to forecast severe pollution events, thereby allowing preventive measures to be set up to mitigate impact on system reliability. An initial pollution map of Italy, elaborated during the 1990s, was based on geographical and local environmental conditions such as type and size of cities, industry, distance from the sea, network problems and weaknesses, local measurements of ESDD on insulators removed from overhead lines, etc. (Fig. 15).
CLICK TO ENLARGE
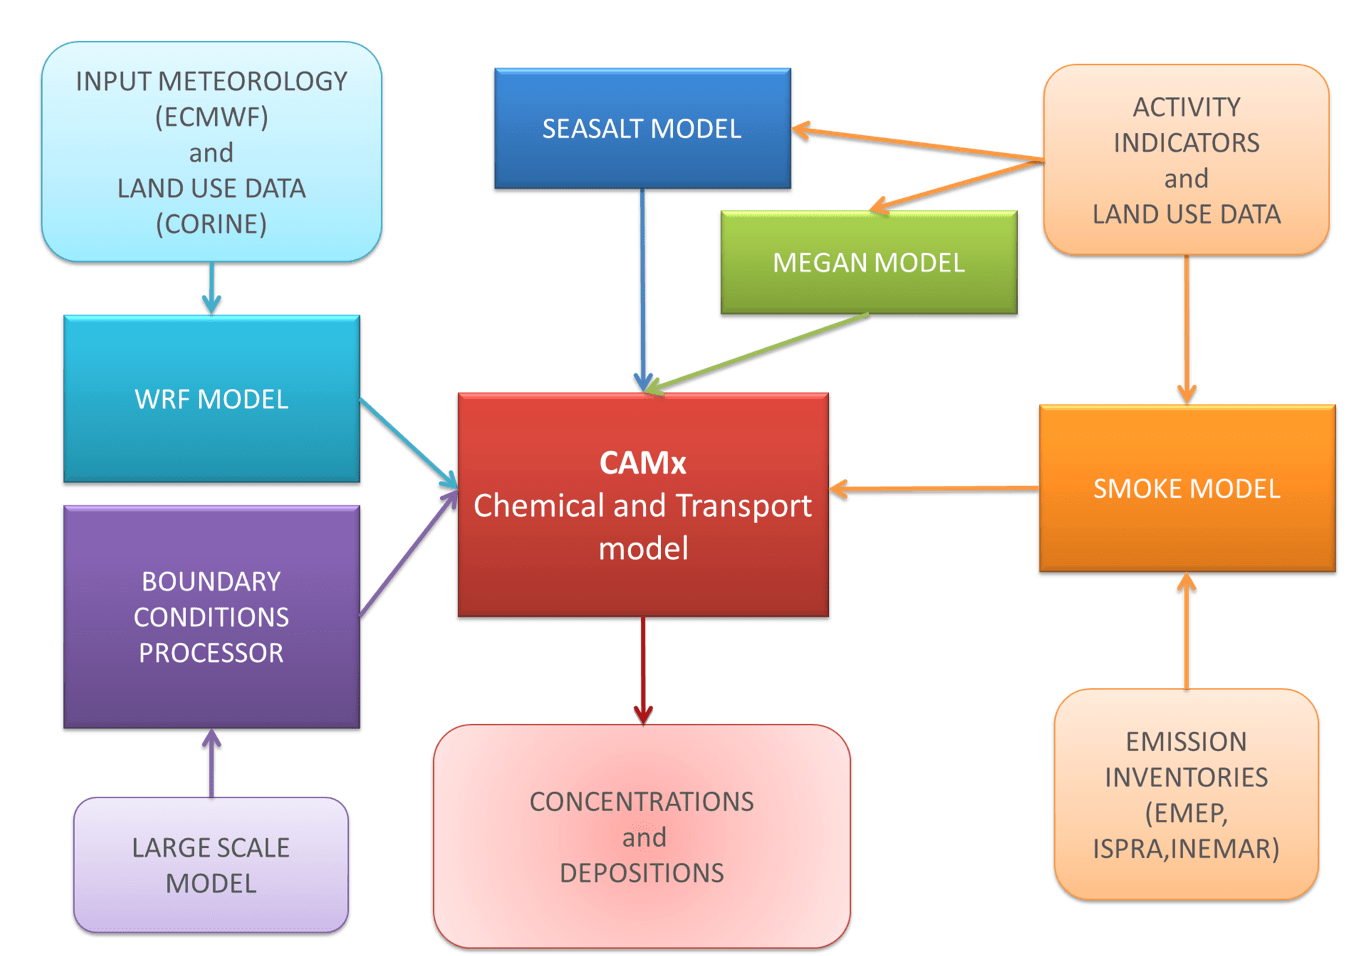
But Italy has undergone numerous changes since that time. For example, evolution of the generation mix towards natural gas and renewables has impacted emissions from power plants while a prolonged economic downturn has reduced pollution from industry. On top of this, climate change has modified the entire panorama. Moreover, use of AMICO monitoring devices installed at critical locations has indicated the need to update this pollution map. Recent studies have demonstrated a strong correlation between dust concentration in the atmosphere and level of pollution deposited onto insulator surfaces. This has opened the way to a possible new approach in assessing and predicting pollution events, e.g. use of weather forecasting and air quality modelling. An entire suite of modelling tools are available: the WRF (Weather Research and Forecasting model) is a physical-mathematical high resolution meteorological model used for weather forecast with meshes of 5 km, while CAMx (Comprehensive Air Quality Model with eXtensions) is a Eulerian model of the chemical and transport processes that pollutants undergo within the lower atmosphere, also having a resolution of 5 km; the processors SMOKE (Sparse Matrix Operator Kernel Emissions), MEGAN (Model of Emissions of Gases and Aerosols from Nature) and SeaSalt are dedicated to human-related, biogenic and sea salt emissions respectively. Fig. 16 describes the general architecture of such a modelling system.
CLICK TO ENLARGE
Pollution events on insulators are linked with a combination of two meteorological situations: an extended period of drought and low humidity responsible for accumulation of atmospheric pollutants over exposed surfaces of insulators (often associated with strong winds that lift material previously settled on the ground or generated by sea spray), followed by periods of high humidity linked to fog, light rain or night dew that moisten polluted surfaces and change their conductivity, potentially leading to flashovers. The physical elements that drive this process are humidity, wind, and the dynamics of precipitation and drought. An additional driver in the case of locations close to the seashore is spray or marine aerosol linked with a combination of waves and breeze from the sea that deposit salt over exposed insulator surfaces. Analysis of the applicability of the model approach was made step-by-step using a re-analysis process, i.e. through re-calculation by means of a model of actual situations observed in the field, specifically at locations close to AMICO sites and near data collection points. The end goal was to forecast build-up on insulator surfaces of a pollution layer characterized by a given ESDD and NSDD. This can only be achieved if three models are validated:
• dynamics of meteorological parameters that are drivers for development of a pollution event (i.e. temperature, humidity, wind speed and precipitation);
• mechanism of formation and transport of solid contaminants in air (e.g. PM10 and its inorganic components);
• mechanism of deposition of contaminants present in the air surrounding insulator surfaces.
The ability of the WRF Model to reconstruct temperature and ambient humidity at 2 m above ground and wind velocity at 10 m above ground was assessed. Results were satisfactory, especially for temperature, while discrepancies were more evident in humidity. Detailed analysis showed that meteorological simulations could be trusted for typical periods relevant for pollution events. The capability of the CAMx Model to estimate the drivers for salt deposit density and surface conductivity on insulators was subsequently verified considering solid particulates, with special reference to PM10 and its inorganic components. Field re-analysis was carried out given AMICO device installation sites as well as air quality monitoring stations belonging to the European Monitoring and Evaluation Programme network located in Montelibretti and Ispra. Comparison between measured and calculated daily concentrations of PM10 and its inorganic ions (i.e. SO4, NO3, NH4, NaCl) in the liquid phase was carried out over an entire year. Results showed an acceptable match, after adjusting for level of precipitation. Finally, ESDD could be estimated based on dry deposition rate for inorganic ions. Preliminary results, reported in Figs. 17 and 18 for standard and polymeric line insulators respectively, are encouraging, although maximum peaks in July and August are greatly underestimated.

CLICK TO ENLARGE

CLICK TO ENLARGE
The mechanism of deposition and possible dissolution of particulates across the complex surfaces of insulators is still not well understood and needs additional research. Although detailed evaluation and forecasting of pollution events is not yet possible with models, this analysis has nevertheless offered the ability of the modelling suite to represent, across all Italy, the driving force behind insulator pollution: i.e. concentration in air of particulates (PM10), with particular reference to that fraction from sea salt. This feature was used to update the Italian pollution map. The new map was constructed based on spatial estimation of PM10 and sea salt considered separately, each categorized over 8 classes of increasing severity and then re-aggregated, doubling the weight of sea salt concentration. Results were then re-grouped into five pollution severity classes, according to IEC 60815 (Fig. 19).
CLICK TO ENLARGE
Compared to the previous map, the pollution class ‘exceptional’ – linked to peculiar situations close to heavily polluting plants – has disappeared. A new class rated ‘very light’ was introduced to characterize alpine areas where risk of flashover due to pollution can be considered negligible. The new map shows dramatic reduction in the level of contamination around the Pisa plain and urban Milan: this area, while heavily polluted by anthropogenic sources, is not affected by saline pollution. The new map also features reduction in severity along the Adriatic coast as well as in the north-eastern region of Puglia. Inland areas of Sardinia and Sicily have been upgraded from ‘light’ to ‘medium’ pollution level. Moreover, areas rated ‘heavy’ pollution in these two regions have been expanded, especially near the west coast. Finally, in Sicily, there was an increase in severity class along the coast of Trapani since it is frequently hit by Mistral winds carrying particles of sea salt. This new pollution map was extensively validated by comparison with measurements carried out by RSE and Italian TSO, Terna, based on more than 200 sampling sites located near high voltage infrastructure.
Heat Waves & Soil Dry Out
A heat wave is a situation with daytime and night-time temperatures unusually high compared to average temperatures typical for that period and region and with a duration of several days. Urban heat waves have been increasing in frequency, intensity and duration – especially in the Mediterranean region. Higher ambient temperatures generally degrade performance of a power system and can cause blackouts, sometimes of extended duration. The last type of situation occurs when rainwater does not have time to be absorbed by soil, which remains in a drought condition. Soil dry out reduces its thermal conductivity and resulting heat exchange capability with underground cables. In these situations, even if their ampacity is not exceeded, cables heat up abnormally and degrade to failure of their insulation systems or, more likely, failure of their joints. Italy has about 200,000 km of underground cables of which 60% is insulated with ‘wet insulation’ that has a failure rate (excluding external causes) of 6 to 10 per 100 km per year. In case of failure, a cable (even if its age has exceeded design lifetime) is normally not replaced but rather repaired, adding n.2 joints as part of each repair.
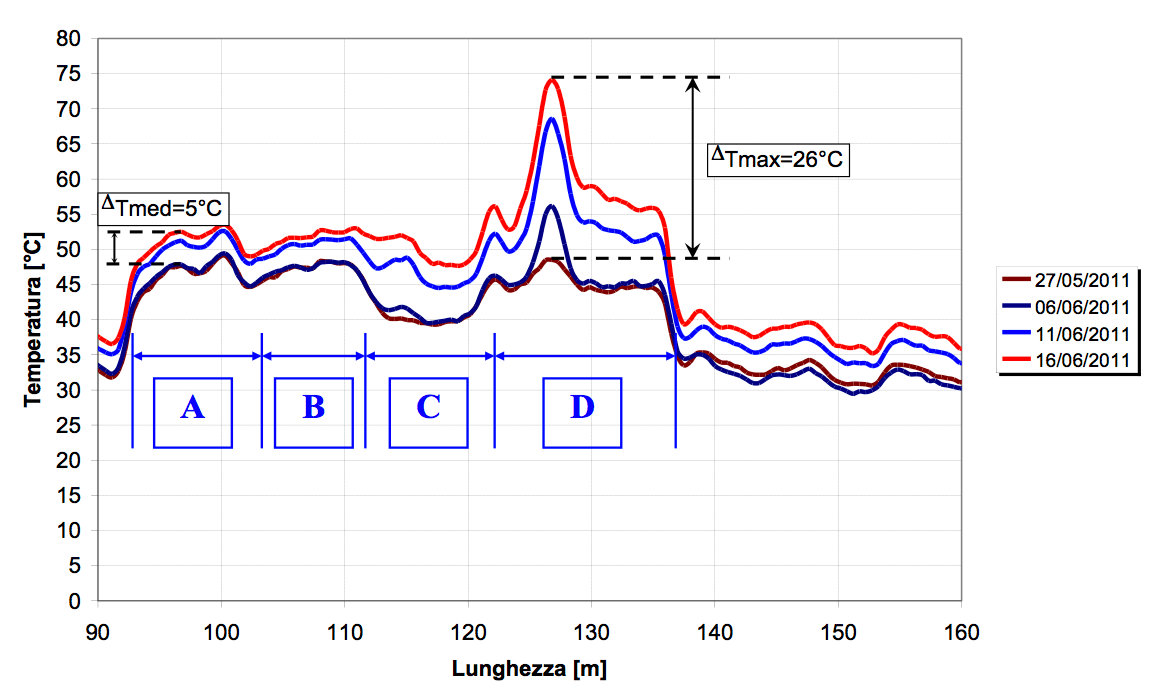
Nearly 70% of internal cable failures (i.e. failures not caused by third parties) occur in joints or terminations. In order to investigate the effects of soil dry-out, RSE installed a series of cable samples over a length of 45 m, under different laydown conditions: the first 10 m (portion A) was laid directly in ground of 1 m width and under a concrete platform; the second 10 m (portion B) was laid in these same conditions but inside a cable pipe; the third 10 m (portion C) was buried in a cable pipe with no concrete platform; the fourth 14 m length (portion D) had no platform and no pipe. All portions were connected in series and rated current was circulated. Conductor temperature was monitored year round. Fig. 20 shows the temperature profile of the cable sample during a soil dry-out event lasting 21 days, i.e. from May 27 when terrain was wet due to persistent rain to June 16 when terrain was dry from 21 days of drought and high ambient temperatures. As can be seen in Fig. 20, heat exchange capability of wet soil is progressively hampered by drought, causing a maximum temperature increase of 26°C for the portion directly buried with no concrete topping, i.e. that section most exposed to changing soil conditions. Increased joint temperature caused by poor heat exchange capabilities is a relatively new threat to power systems and underlines vulnerabilities not previously considered. To avoid or limit contingencies linked with this threat, monitoring and diagnostic techniques are being researched. These are based on pick-up, analysis and interpretation of partial discharge patterns to predict incipient failure of cables and accessories. This will enable distribution utilities to identify weak points in their networks and take corrective action.
CLICK TO ENLARGE
Extensive campaigns have been carried out in the field to identify the weakest lines and to subject them to occasional ‘controlled’ failures without load and with artificially increased dielectric stress to avoid stochastic failures under critical service conditions. Increased thermal resistivity induced by soil dry-out is also accompanied by increasing soil resistivity that may adversely influence grounding systems. Vulnerabilities associated with this type of threat are not only linked to safety of personnel from step and contact voltages but could also impact equipment conditions from direct and induced overvoltages, instrumentation errors and harmonic distortions. Worsening grounding conditions linked with soil dry-out can be significant and increases in grounding resistance of as much as 5-fold have been reported when going from ‘normal-wet’ to ‘dry-out’ conditions. This might require reconsidering some of the assumptions made during design of insulation and its co-ordination, such as protection level of surge arresters, risk of backflashover of line insulators, etc.
Reverse Environmental Constraints: Assessing & Limiting Impact of Power Networks on Local Environments
The electric network is a capillary structure that spreads across substantial territory and its presence can negatively impact local as well as global environments. Indeed, recent public concern about this across Europe has resulted in delays of from 10 to 20 years in the permitting and realization of new transmission infrastructure. Unfortunately, such delays are not acceptable in society’s transition towards a de-carbonized and de-centralized energy system where integration of a high share of renewables requires strong, reliable transmission networks. Visual impact and electromagnetic field generated by lines are among the most cited and debated impacts of overhead lines. Other aspects raised by opponents are hurting wildlife, noise, lower property values and damage to archaeological and other sites of interest.
With the goal of narrowing the divide between power project promoters and opponents, a recent European funded project, INSPIRE-Grid, identified factors that influence public resistance to new infrastructure and proposed methods to overcome these. The primary factors identified were the needs, wants, concerns, and expectations of local stakeholders and also the costs, benefits, risks, and implications of each specific project. Other influential factors identified were linked to the processes by which people learn about, discuss and participate in decisions about a proposed new project. To rationalize and document the needs of the different parties involved, a joint stakeholder map was developed that highlights sources of potential conflict as well as possible entry points for tailor-made solutions. Analysis of past and current project dynamics has confirmed the importance of stakeholder participation starting during the planning phase. A variety of means are used to promote such involvement over the entire process, from planning to construction. These start from information (e.g. at websites, in printed matter, through media, with field visits and open days), to consultation (e.g. round tables, interviews, surveys, public debate, panels) and finally to co-decisions (e.g. advisory committees, mediation, citizen juries and task forces). In fact, current processes often lack when it comes to addressing and demonstrating the need for power lines. They also fail in setting up structured participatory decision-making mechanisms to manage inputs from all the stakeholders. Another area where current processes have been found weak is in rational evaluation of technology alternatives or routes, e.g. overhead versus underground, HVDC versus HVAC. INSPIRE Grid has proposed a formal multi-criteria analysis (MCA) method to select the most suitable alternative in an integrated as well as participatory manner. MCA allows all stakeholders to structure the debate and facilitates participation and negotiation – especially by helping establish a climate of confidence and by providing common understanding of problems. Different methods can be used to describe and assess the possible alternatives considered.
CLICK TO ENLARGE
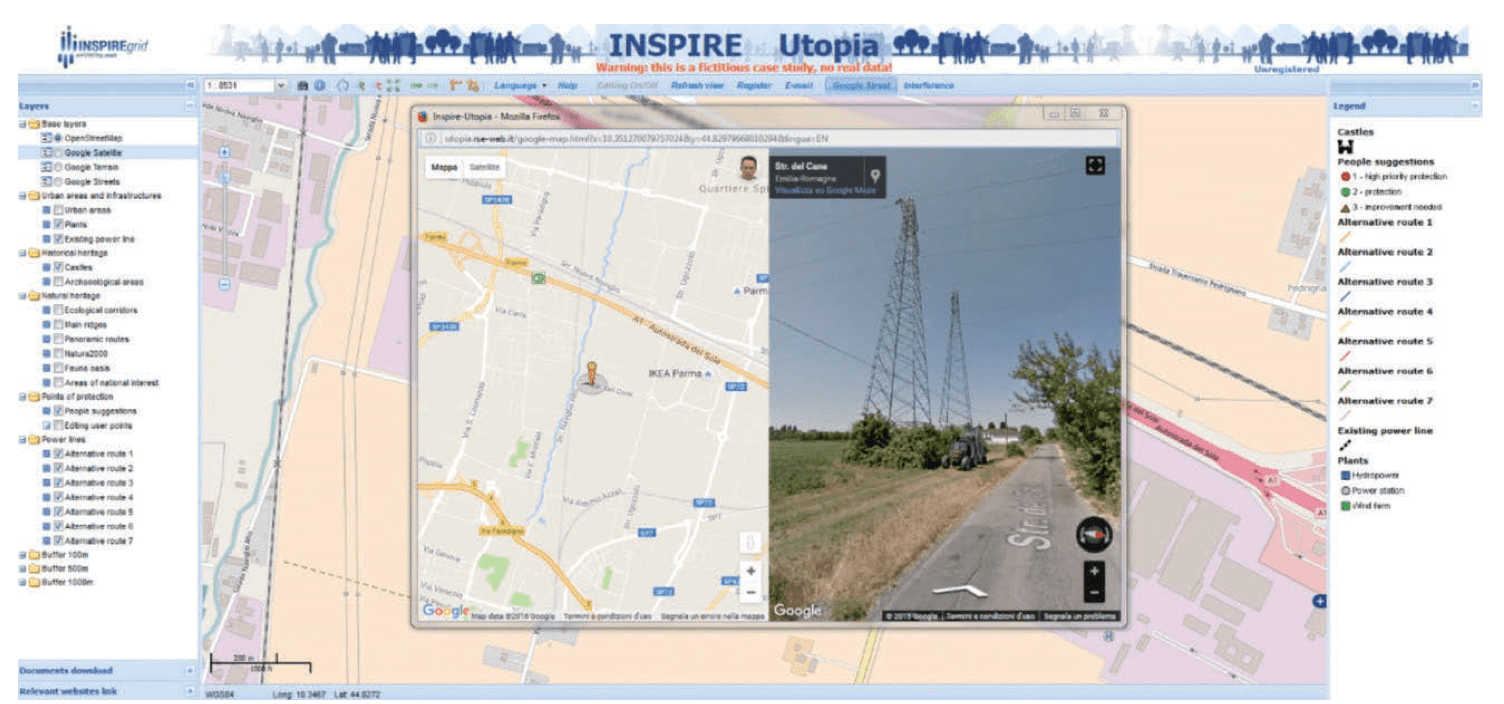
For example, CIGRE C3.08 studied an Externalities Approach, consisting of both economic valuation and balance of environmental impact. They demonstrated that the economic value of property, land use and transmission losses can be rationally assessed since these relate to market prices. Landscape visual impact and biodiversity, on the other hand, are more difficult to quantify. A contingent valuation method can be used for visual impact, by involving the public and asking how much they would be willing to pay or to be compensated for the availability or lack thereof of a specific ‘contingent’ environmental service. In regard to biodiversity, in particular bird collision, there is no consensus on economic valuation methods. Application of MCA to real cases has shown its ability to create a reduced set of alternative power line routings by using stakeholder preferences in ranking effects and generating acceptance for the outcome when stakeholders agree on the ranking. However, MCA did not necessarily foster systematic stakeholder acceptance of outcomes. Public involvement in decision-making can take advantage of modern ICT applications. For example, a participative Web-GIS tool was developed by INSPIRE-Grid to enable stakeholders to interact with decision-makers and to express their opinions about possible alternatives or solutions. In particular, a tool was developed for sending comments and documentation related to a specific location and for indicating preferences about any landmarks to be protected. An interference indicator able to measure how much the different options interfere with points preferred by the public was also implemented and Fig. 21 shows an example of a web-GIS. Application to real projects has demonstrated its usefulness for stakeholders to communicate spatially related points of view with owners. However, the method showed limitations when it came to representativeness of the affected population in this type of information exchange. Therefore, there is need for further investigation, ideally with active involvement of those authorities that grant permits, to enhance robustness of the methods proposed in terms of perceived transparency and justice.
Indirect Environmental Impact of Grid Projects: Life Cycle Assessment (LCA)
Life Cycle Assessment (LCA) is a method to assess global environmental impact of products or services over the course of their entire lifetime. Workflow in conducting LCA studies has now become standardized and comprises the following phases: definition of goal and scope, life cycle inventory analysis (LCI), life cycle impact assessment (LCIA) and life cycle interpretation phase, together with related sensitivity analysis and validity checks. Conducting an LCA for power system components can be useful in identifying opportunities to:
1. improve environmental performance throughout their lifecycle;
2. inform and support stakeholders along the process of planning, construction and operation of networks; and
3. provide a set of prominent indicators to assess environmental performance.
The methodology considered in the ISO standard can be applied to all types of products and services and therefore needs specific guidelines to be applied to electrical systems and components. This is the goal of on-going research and RSE has proposed a series of guidelines applicable to LCA for power systems and components. For all systems considered, the various environmental impacts of a power project are due mainly to their indirect effect on electricity production. But impact can also vary depending on different scenarios considered for evolution of a power system. For example, impact due to building, maintenance and dismantling overhead line infrastructure is almost negligible on environmental categories such as climate change, ozone depletion or human toxicity and cancer effects, even though these are a source of resource depletion due to their use of galvanized steel.
Conclusions
Climate change and the various threats linked to it are more and more influencing design and operation of power systems. Traditional mechanical dimensioning criteria as well as insulation coordination approaches should therefore now be questioned in light of the ever-increasing level and frequency of exceptional stresses linked with extreme weather. If one considers the normal system adequacy approach, i.e. the N-1 criteria, lines in most power grids, including in Italy, would require refurbishment to increase robustness in the face of rising threat levels. On the other hand, adopting the resilience approach, where operation of the system in a partly degraded state is contemplated and where measures are in place to assure prompt recovery after failure, would limit need for such interventions. Rather, the focus would shift to operational planning with reliance on increasing observation, forecasting, prevention and reaction. To this aim, a suite of tools has been developed to evaluate risks linked to climate change, forecast events, anticipate failures and identify the best mitigation measures so that preventive and corrective measures can be in place when needed. Such tools, presented above, are linked to wet snow, intense storms, pollution events and droughts and must be looked at as part of a broad, more complete approach to resilience, including dynamic evaluation of the impact of single or cascaded contingencies. This will aid decision-making by network operators. Work is still underway to validate and integrate all these elements. Impact of an electrical system on the environment has also been addressed in light of web-GIS tools and resulting LCA to increase stakeholder participation in all phases of development and realization of new line projects.

